

Maps - 2010 PL 94-171
Source: US Census Bureau
Linked From: NODIS
Format: PDF Format
Description: Maps provide statistics for year 2010 from PL 94-171 census data. For additional information information contact NODIS.
Note: Maps are in PDF format
| Ohio's Population Change 2000 to 2010 | 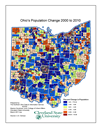 |
Population Change 2000 to 2010 | 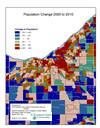 |
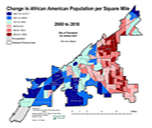
| Population Change 2000 to 2010: Change in African American Population | 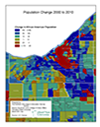 |
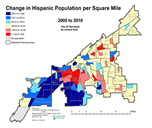
Population Change 2000 to 2010: Change in Hispanic Population | 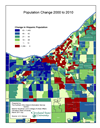 |
|
Change in African American Population per Square Mile |
 |
Change in Hispanic Population per Square Mile |
 |
| Change in Housing Units per Square Mile | 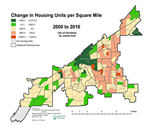 |
Change in Percent Vacant 2000 to 2010 | 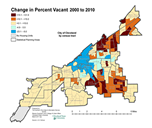 |
| Change in Housing Units 2000 to 2010 | 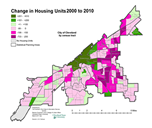 |
Change in Vacant Units 2000 to 2010 | 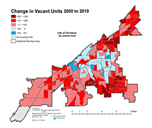 |
| Change in Population per Square Mile | 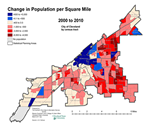 |
Ohio's Housing Vacancy Rate 2010 | 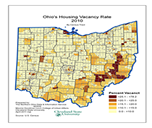 |
| Change in Ohio's Housing Vacancy Rate 2000 to 2010 | 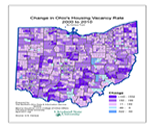 |
Change in Ohio's Housing Vacancy Rate 2000 to 2010 (Change in rate) | 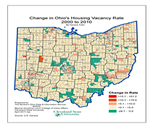 |
| Percent Asian 2010 | 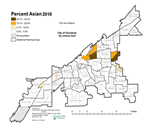 |
Percent Change in Housing Units 2000 to 2010 | 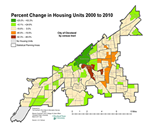 |
| Percent Change in Vacant Units 2000 to 2010 | 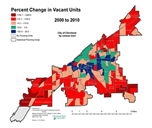 |
Percent Hispanic 2010 | 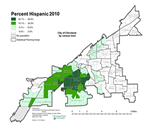 |
| Percent Vacant Housing Units 2010 | 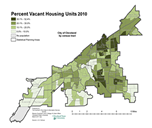 |
Nursing/Skilled-Nursing Facilities Group Quarters Population By Census Tract in 2010 | 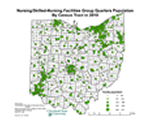 |
| Group Quarters Populations, 2010 | 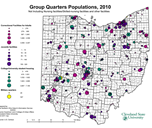 |
Nursing/Skilled-Nursing Facilities Group Quarters Population By Census Tract in 2010 | 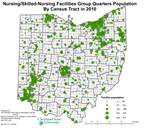 |
| Poverty Rate by Census Tract | 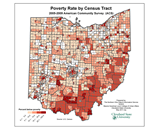 |
Poverty Rate by Census Tract | 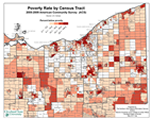 |
| Persons Below Poverty | 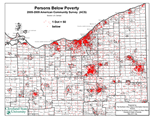 |
Maps - 2000 SF3, SF1 and PL 94-171
Source: US Census Bureau
Linked From: NODIS
Format: JPG Image Format
Description: Maps provide statistics for year 2000 from SF3, SF1, and PL 94-171 census data. Maps are available for Cleveland city, Cleveland-Akron-Lorain CMSA, Ohio counties, and other geographies. For additional information contact NODIS.
Cleveland City Maps
Note: Cleveland Ward maps and data do not reflect the 2010 revisions.
| Cleveland Downtown Resident Population - Census 2000 | 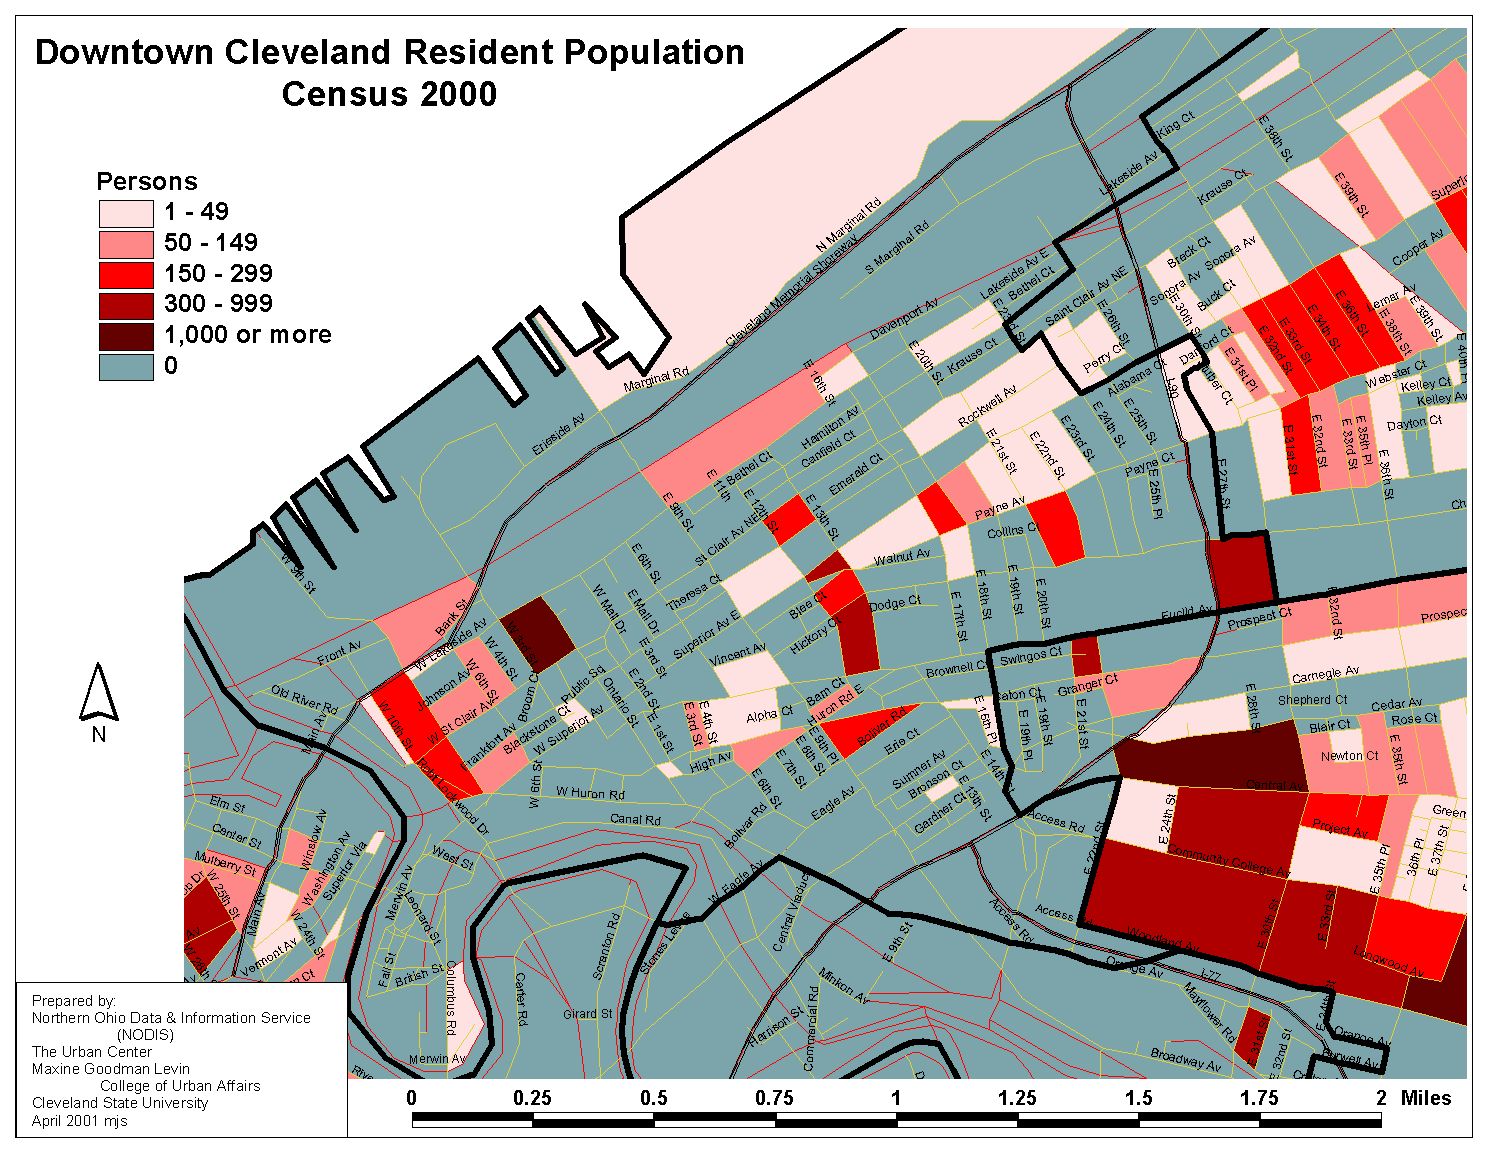 |
Change in Population 1990-2000 | 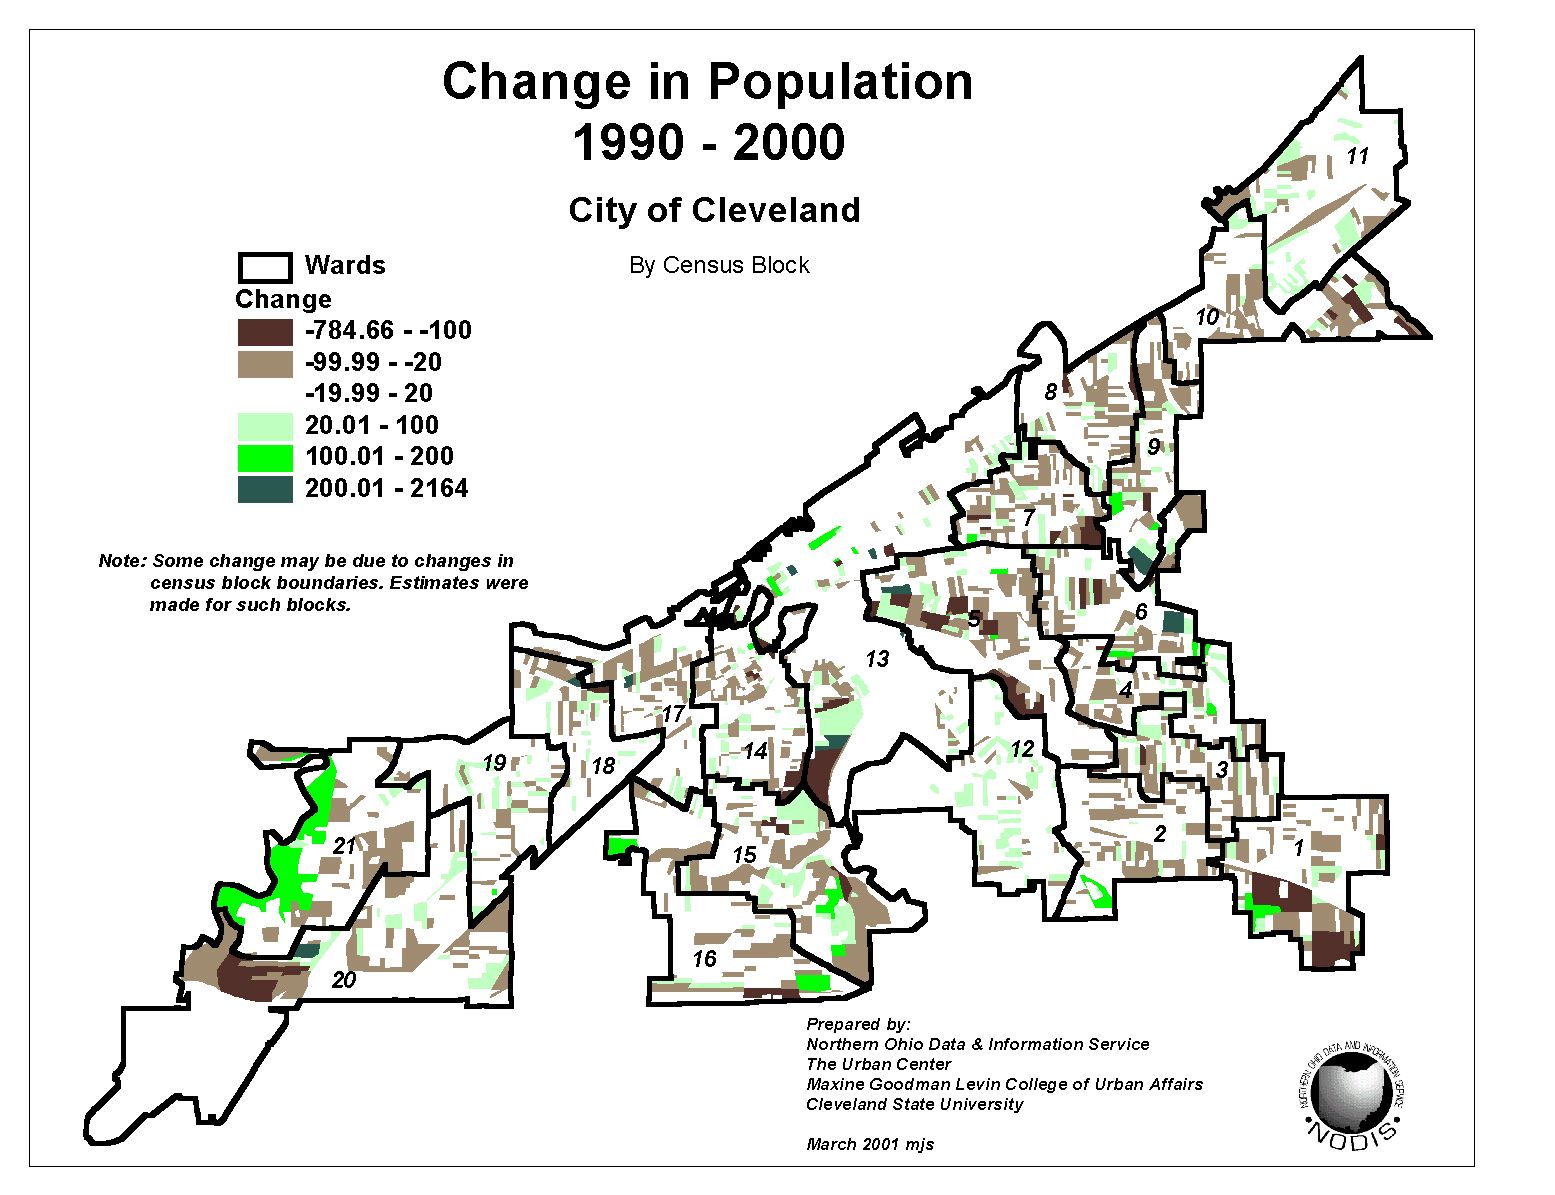 |
| Change in Black Population 1990-2000 | 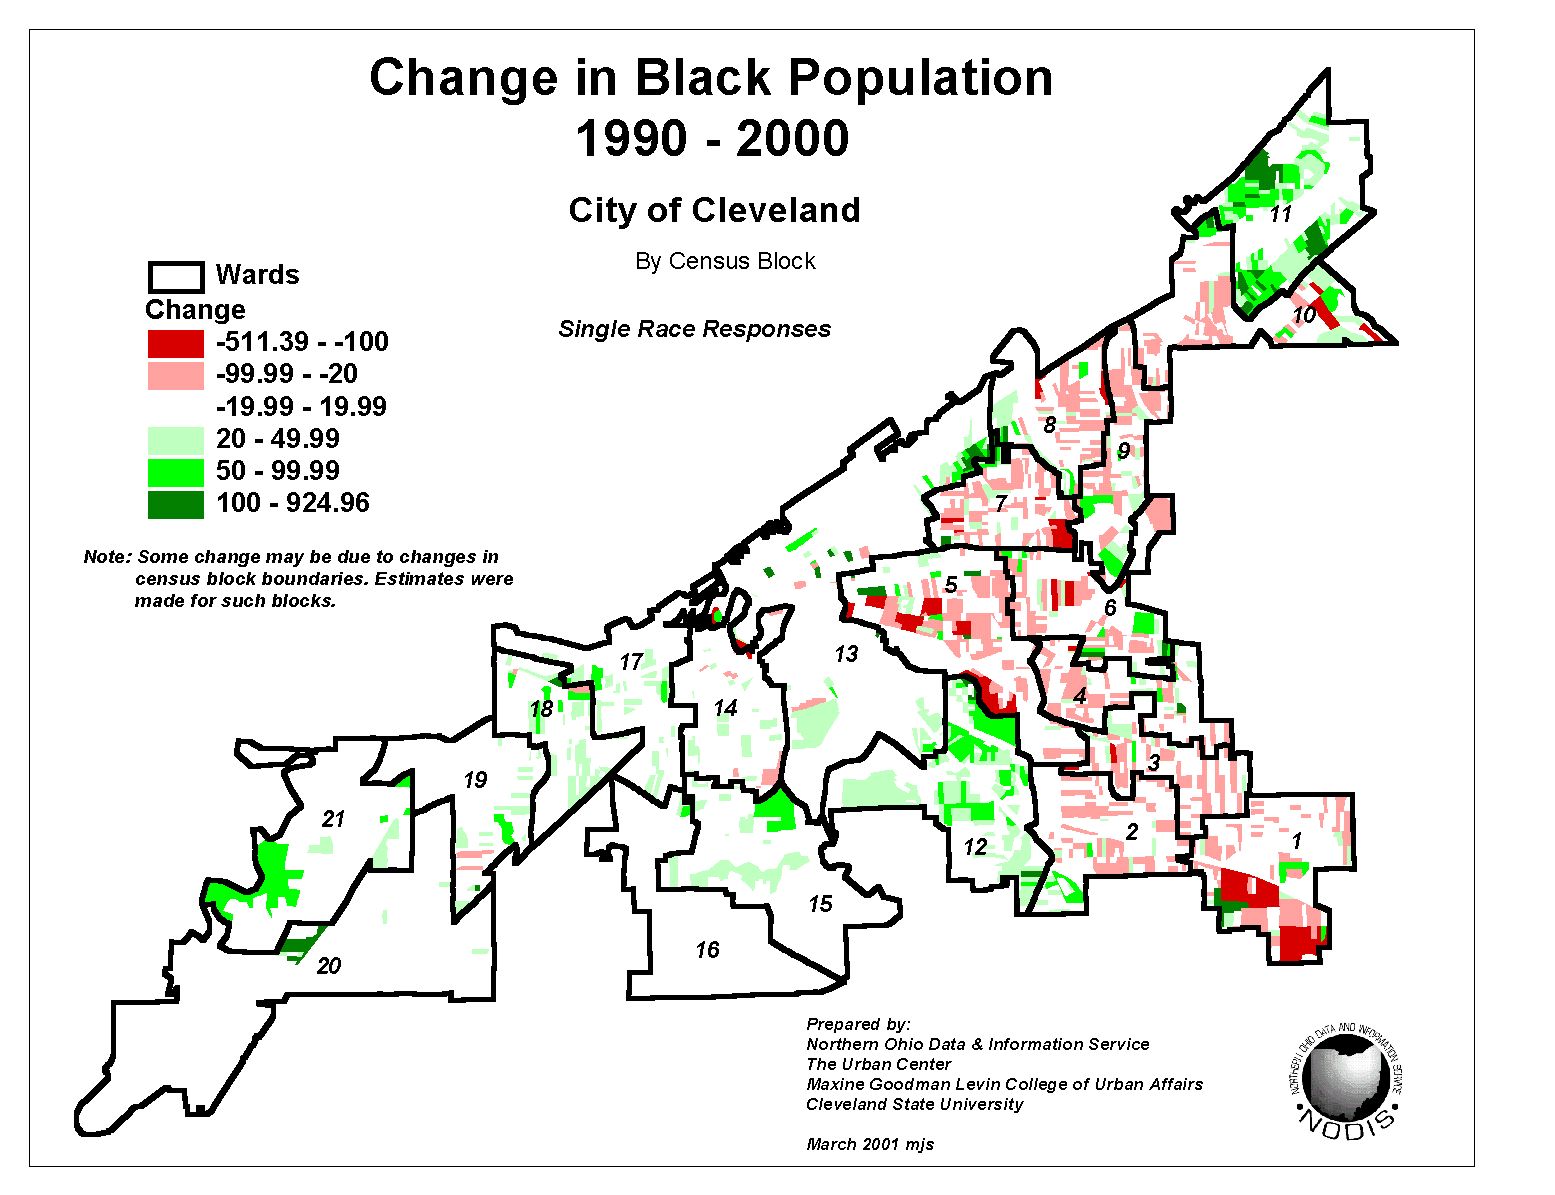 |
City of Cleveland Wards | 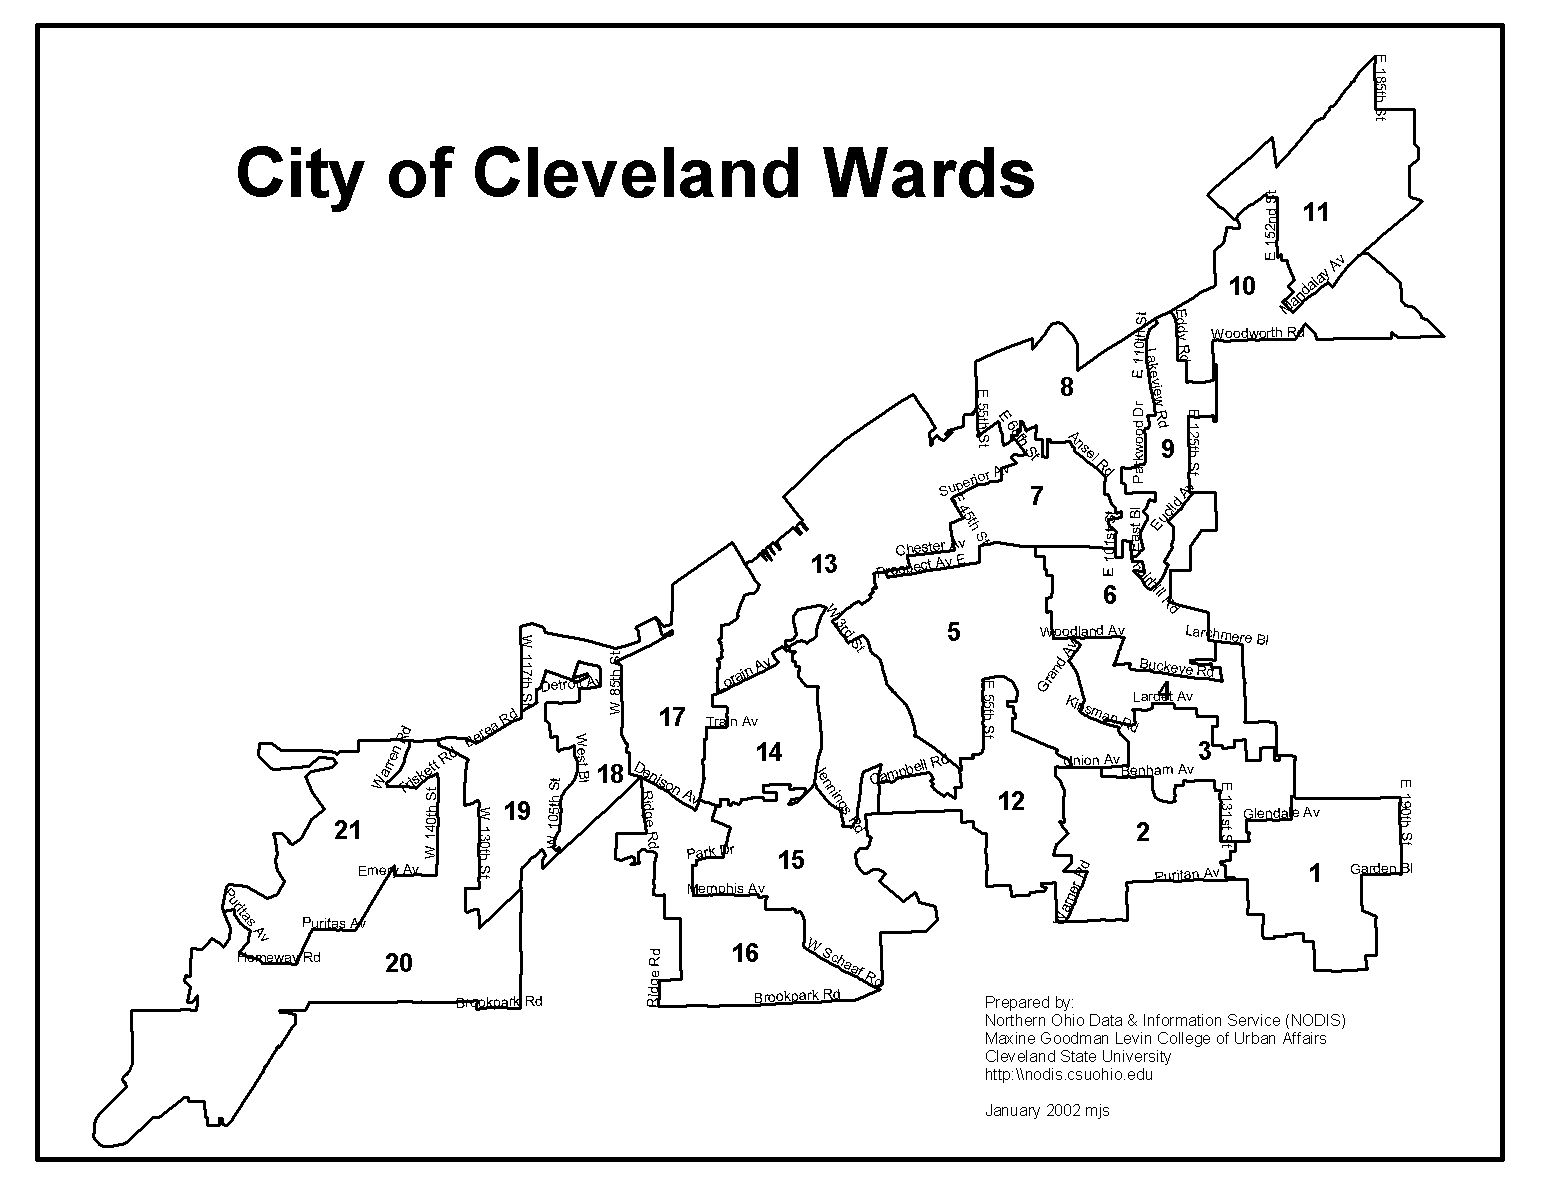 |
| Change in Hispanic Population 1990-2000 | 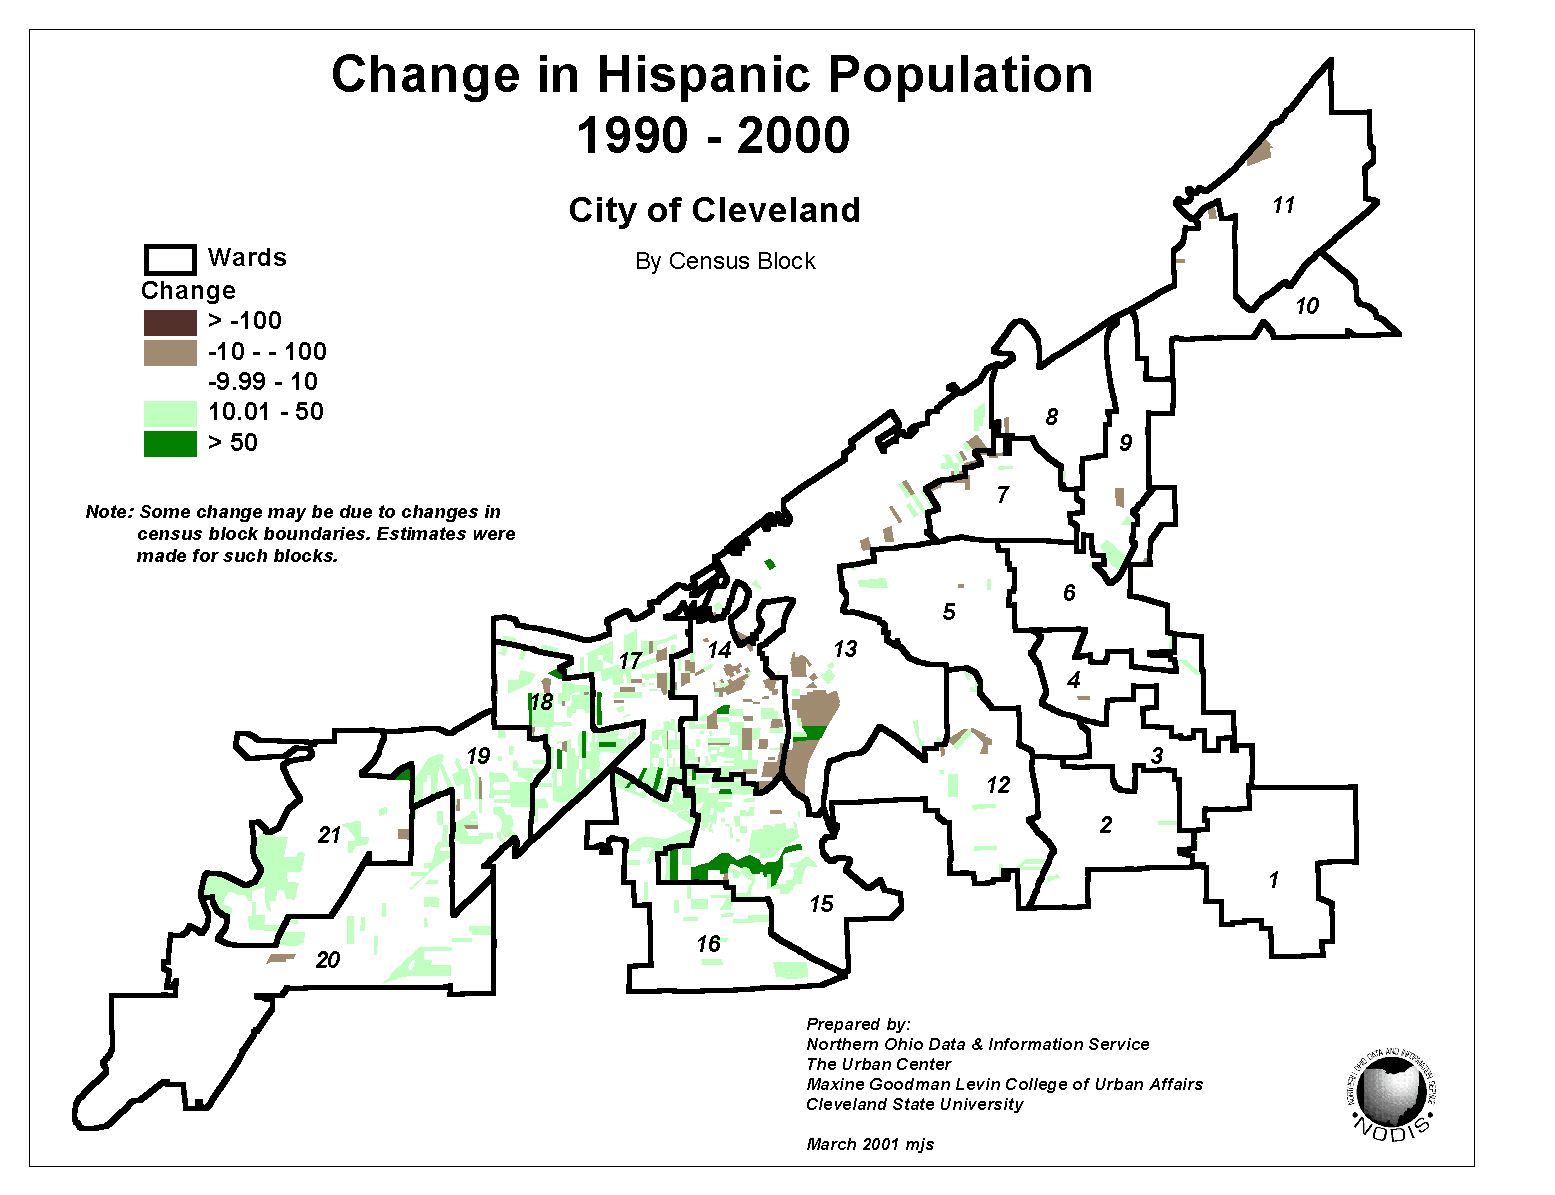 |
Large (3' x 4') Map of City of Cleveland Wards (PDF format) Zoom in to see streets and other details |
 |
| Median Household Income in Cleveland and Vicinity | 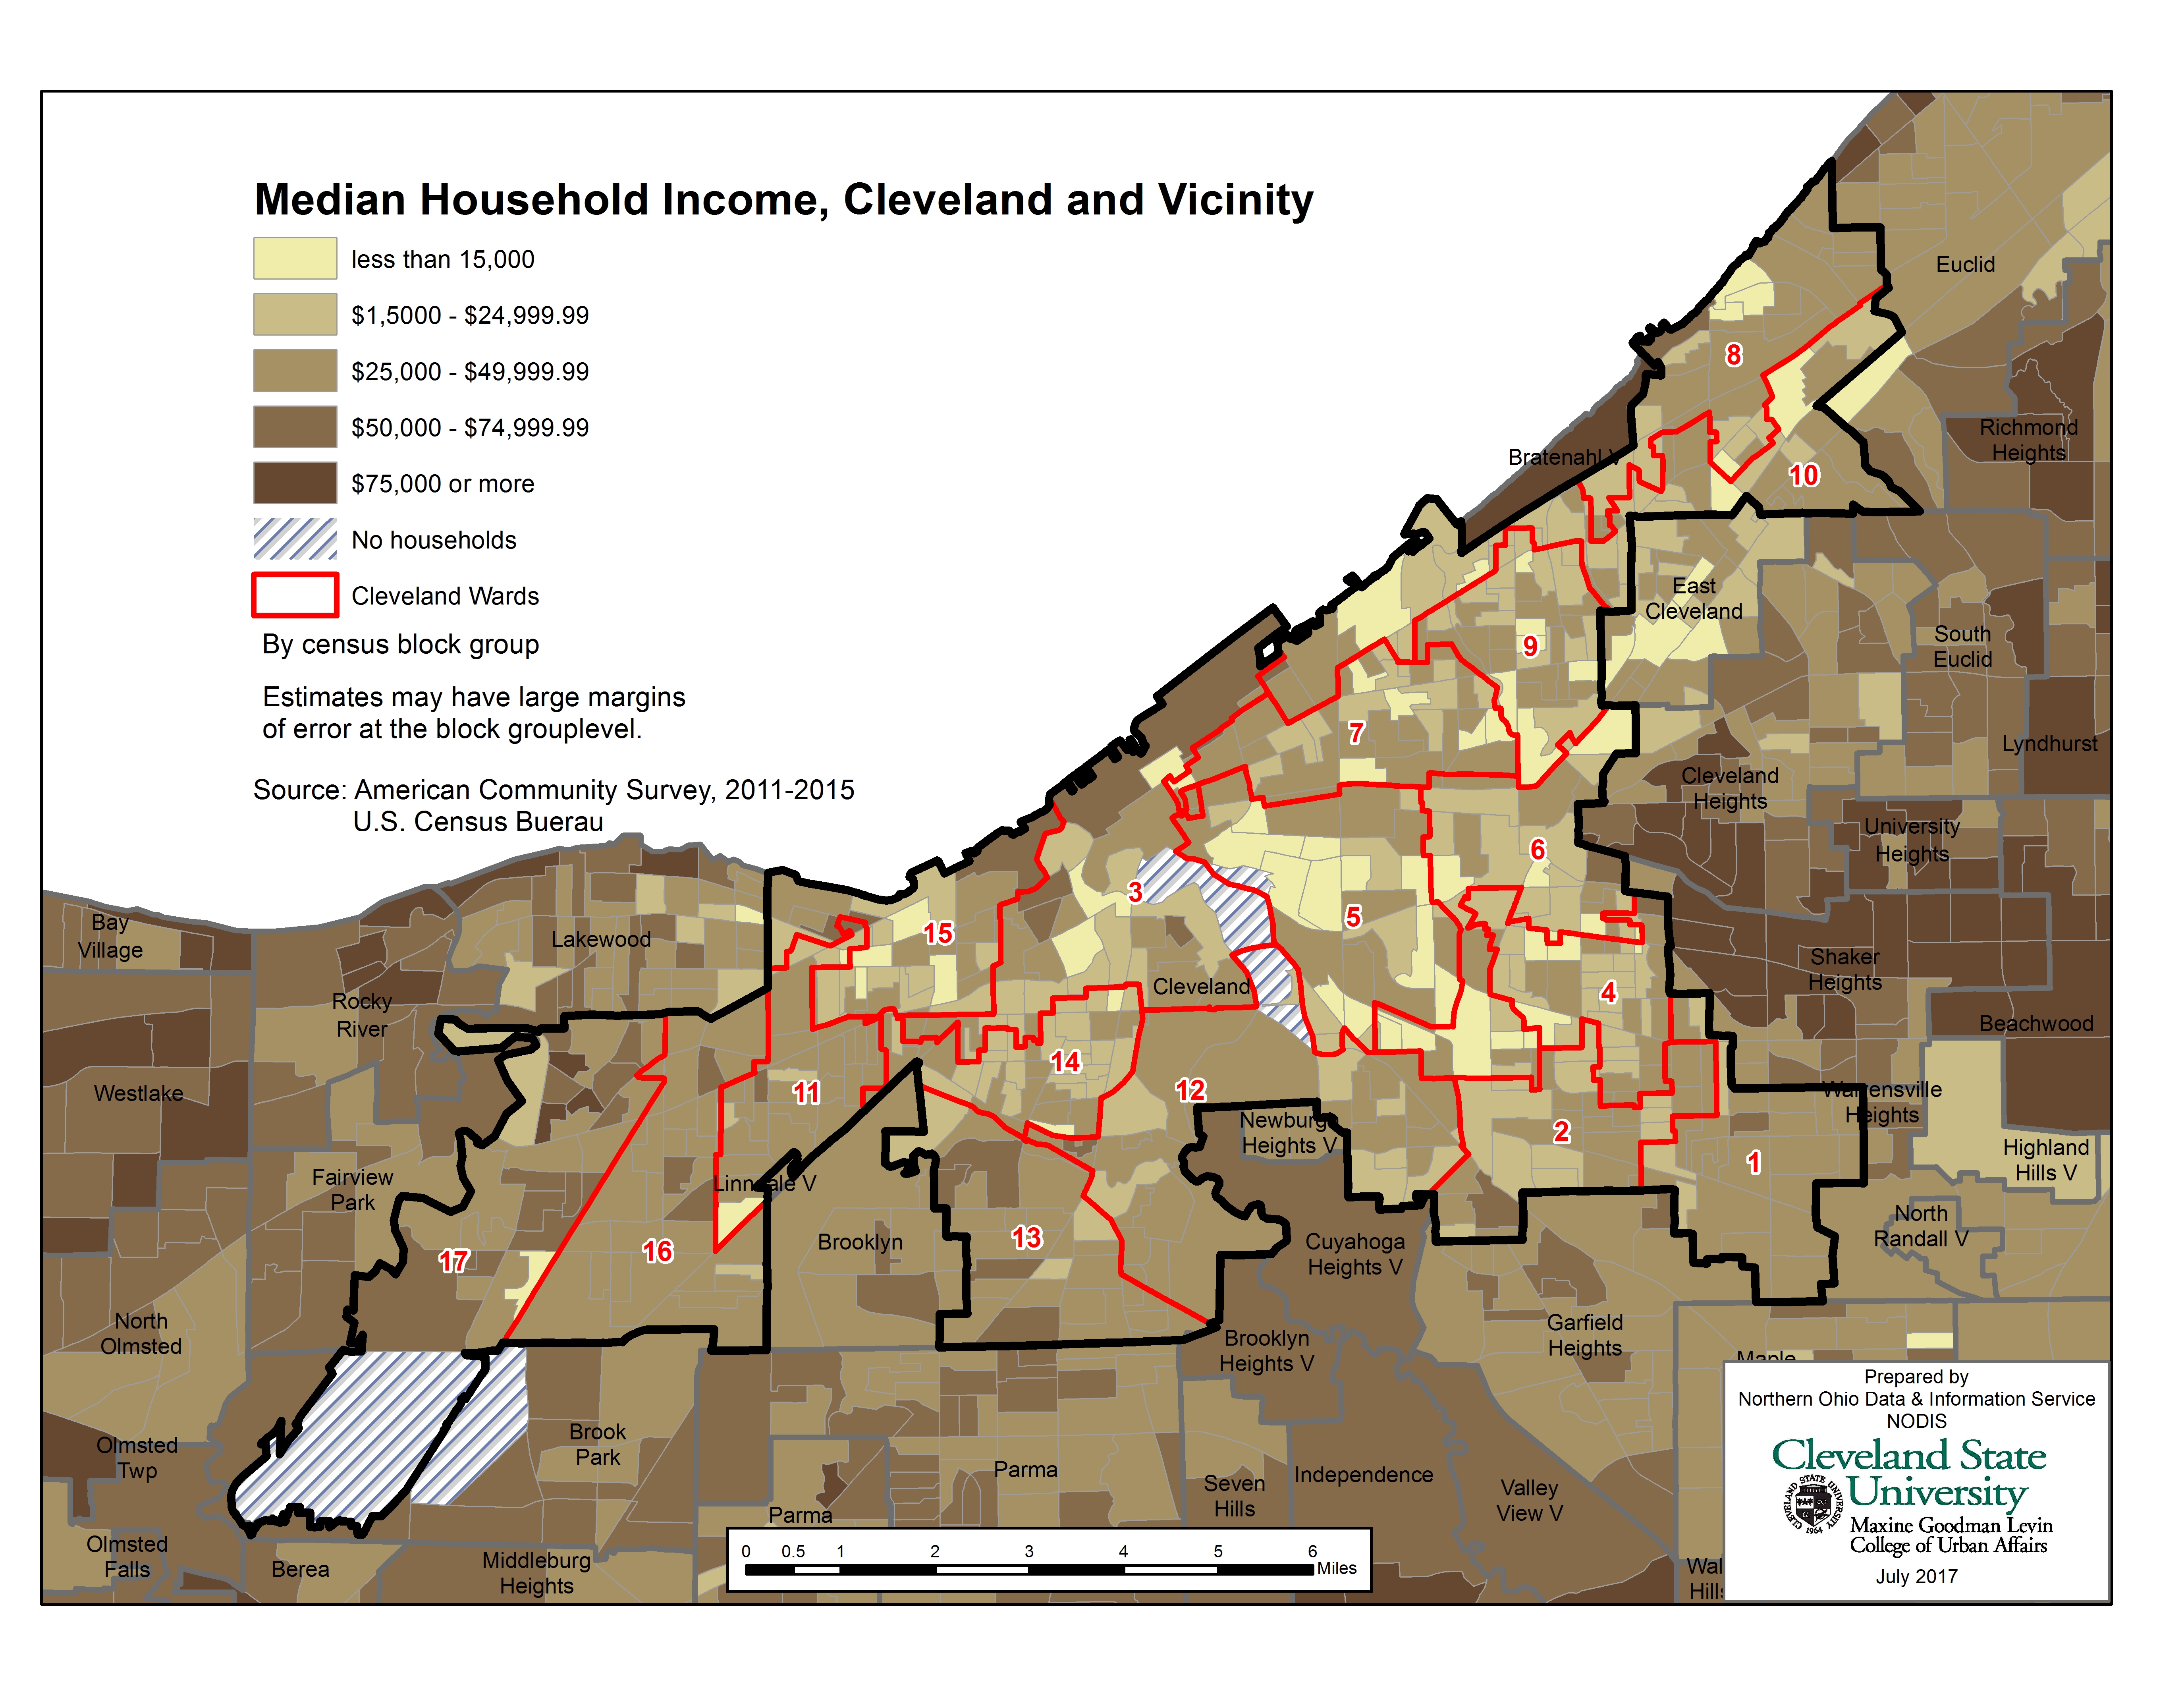 |
Percent Below 200% of Poverty Level in Cleveland and Vicinity | 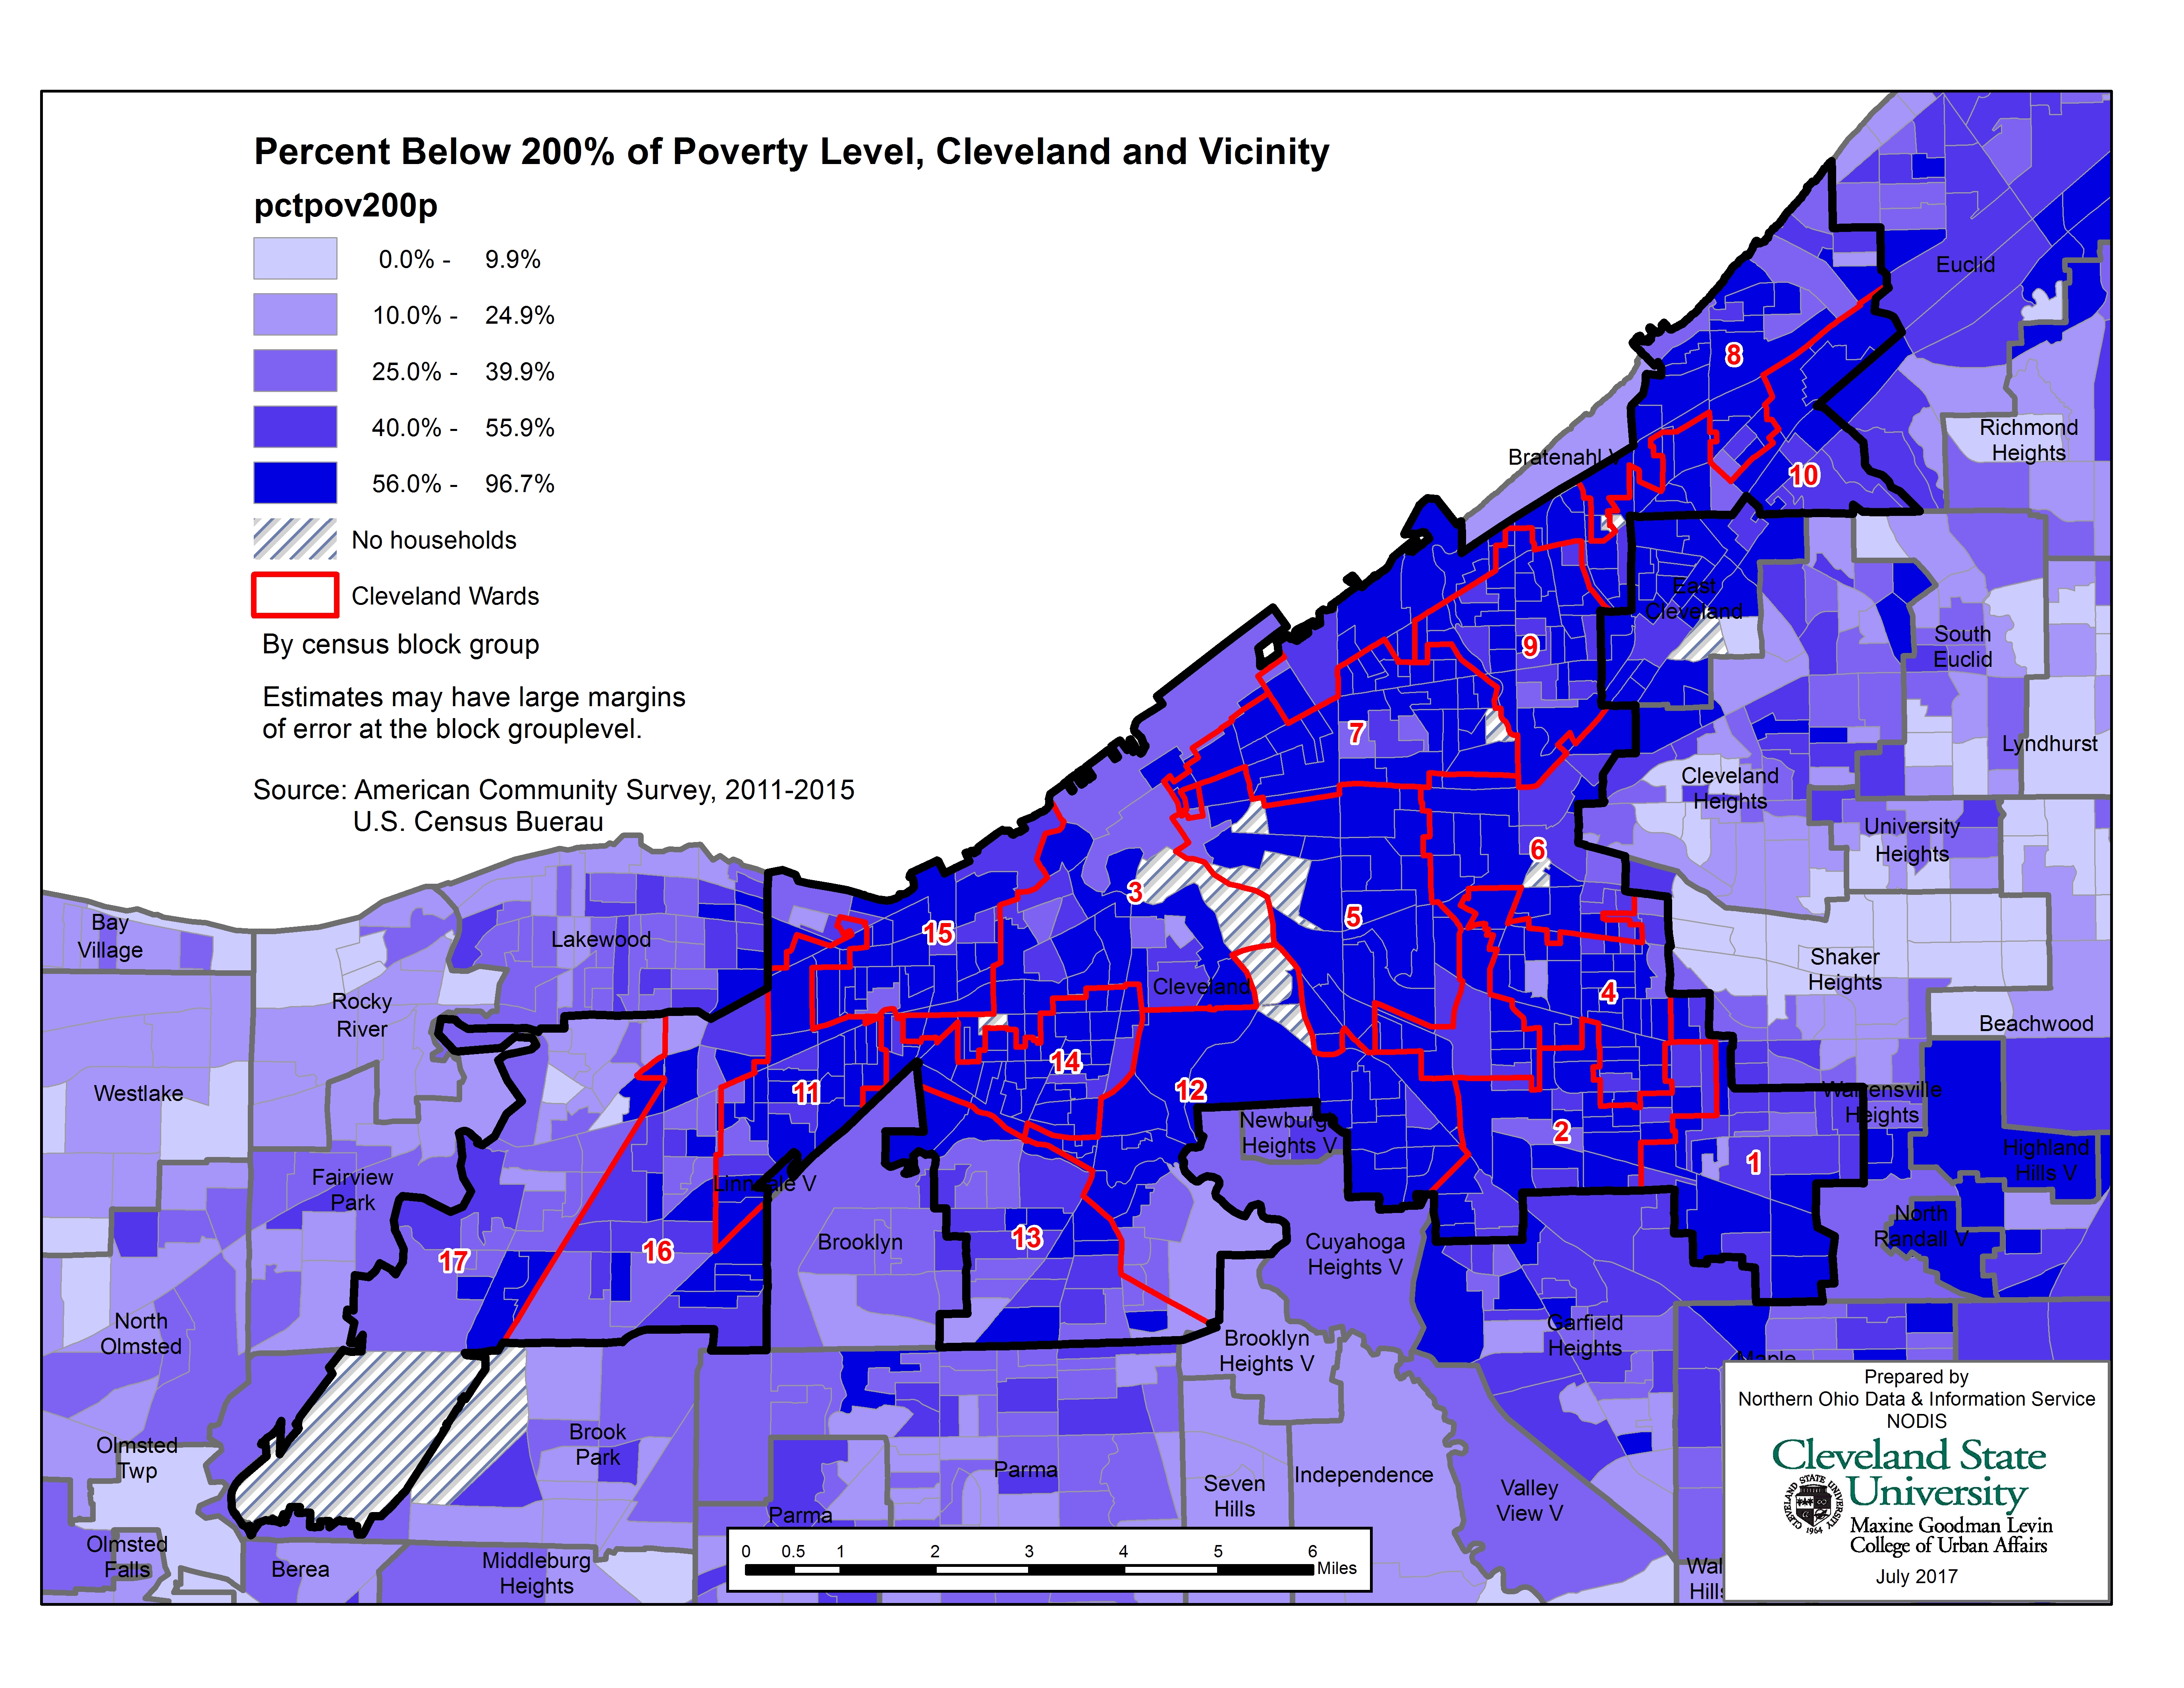 |
| Percent Vacant Housing Units in Cleveland and Vicinity | 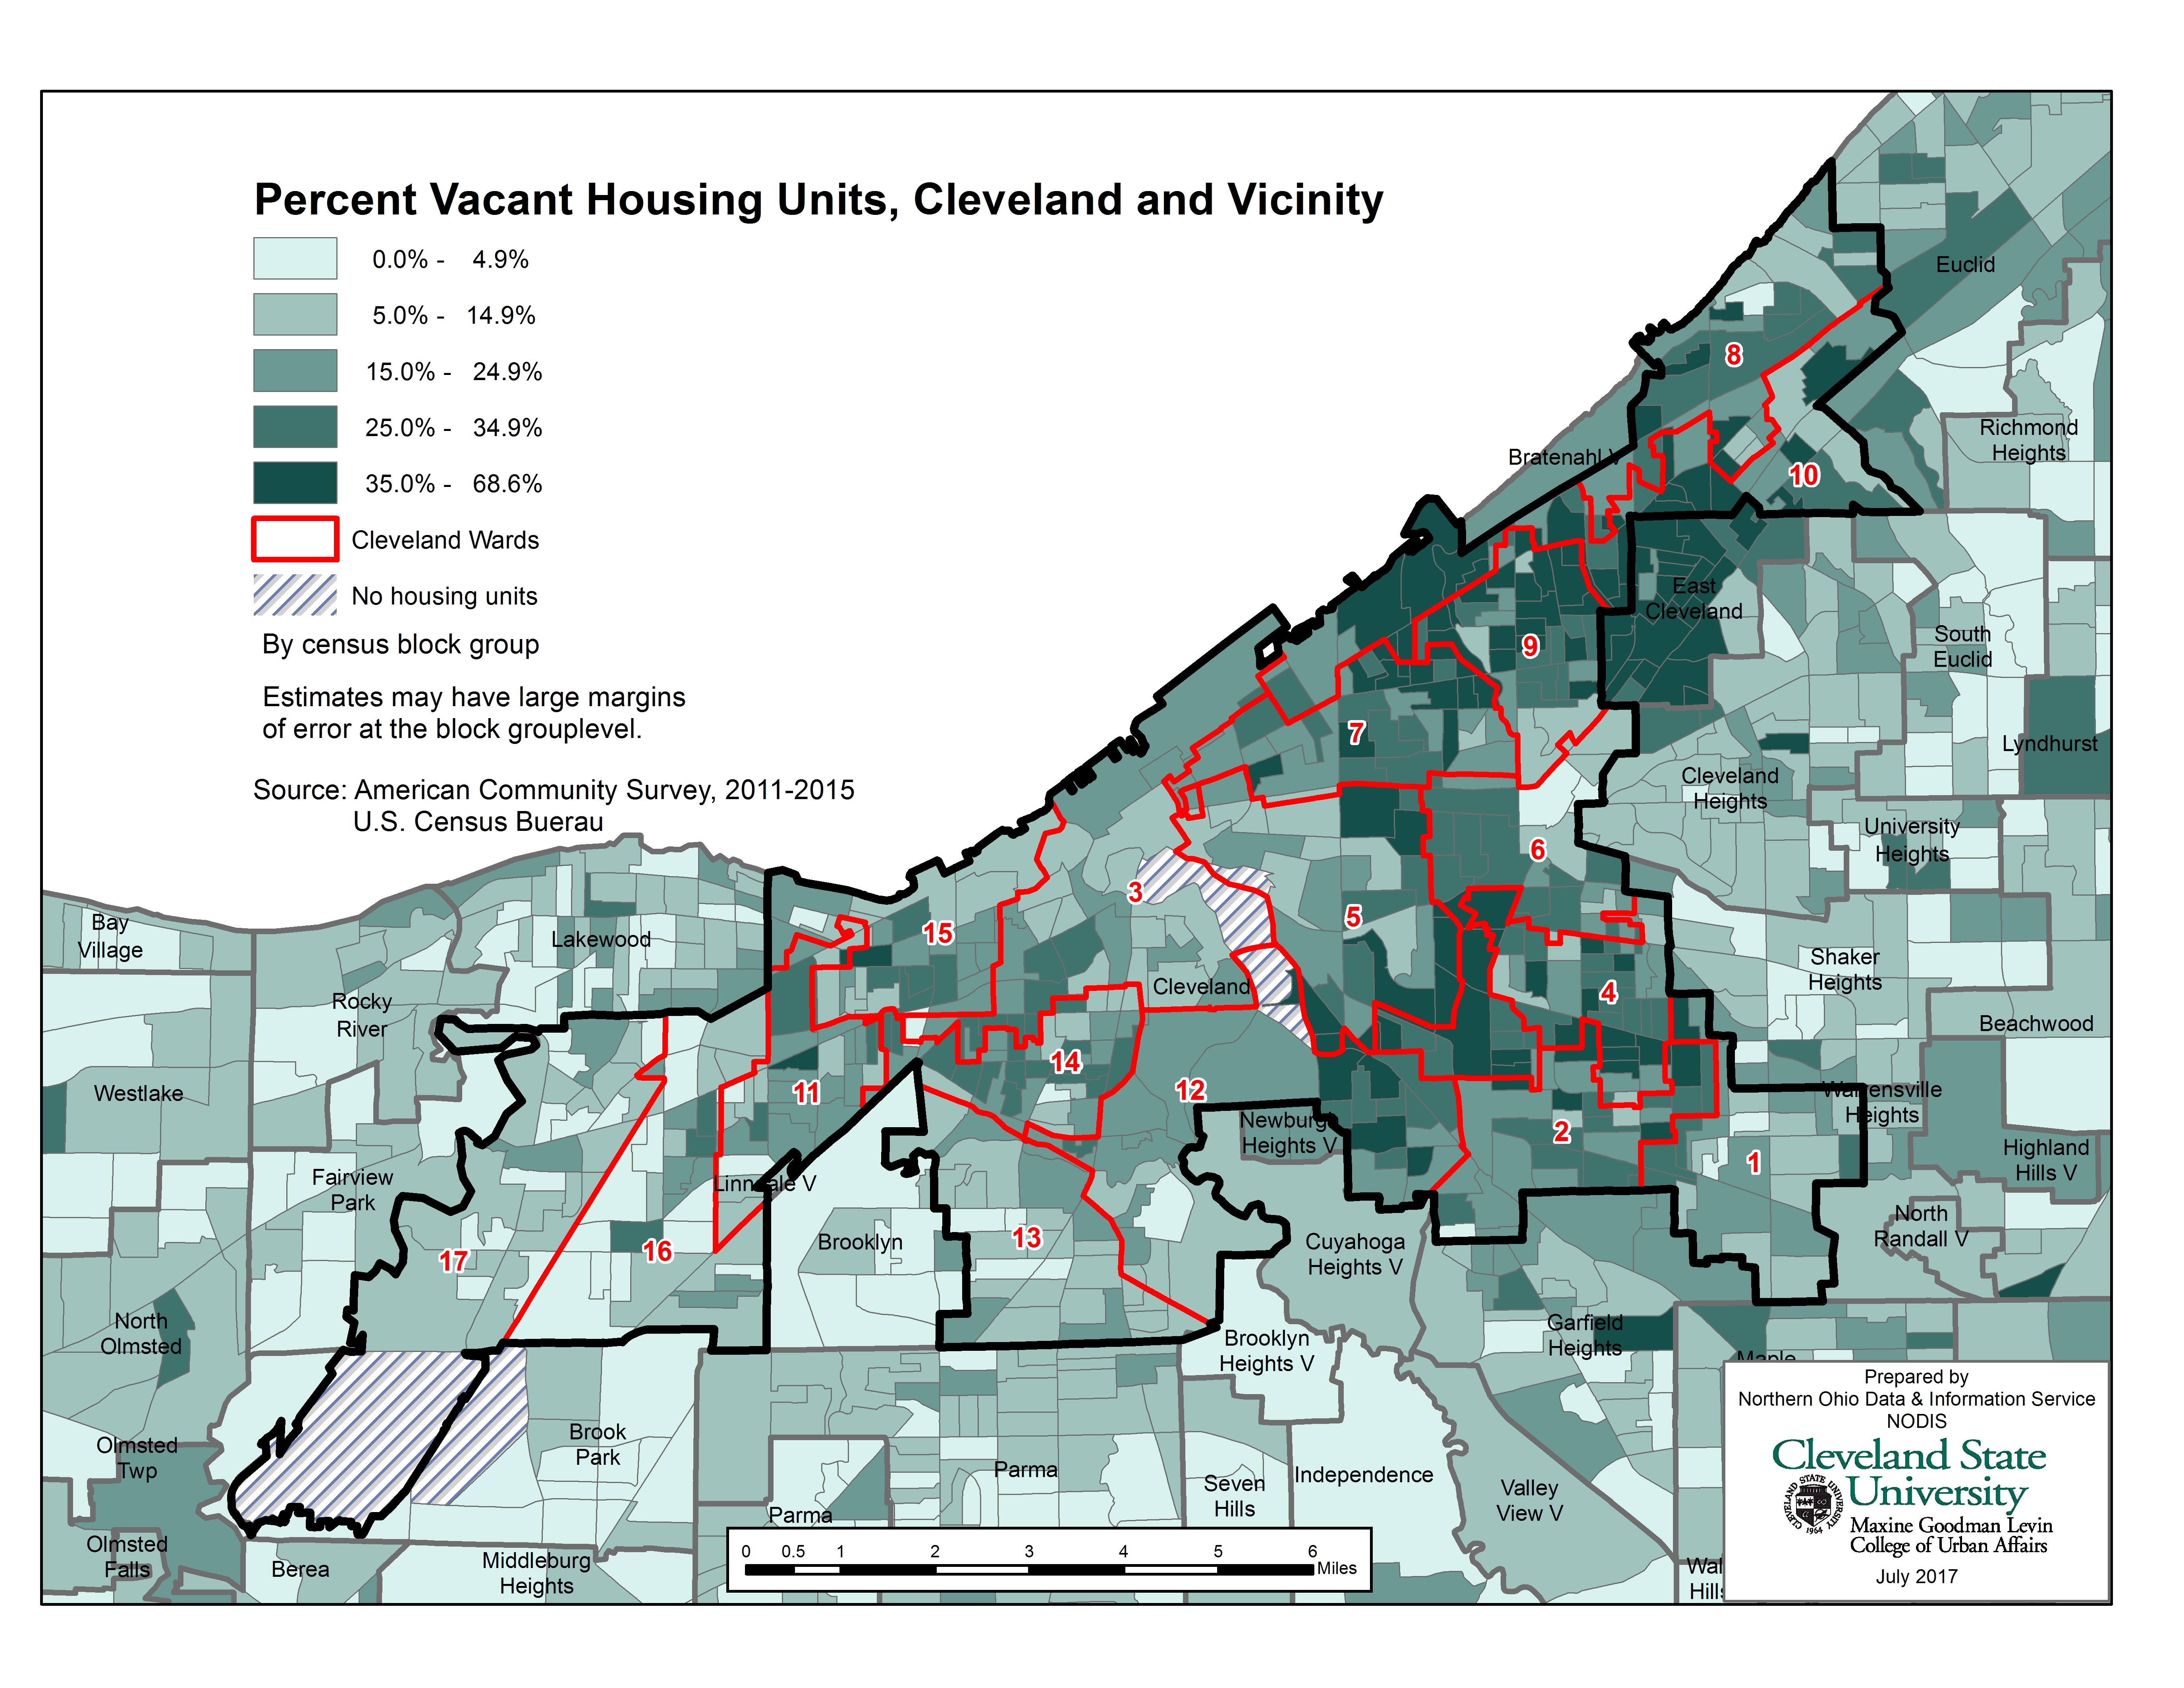 |
Percent Population Change 2010 to 2015 by Census Tract | 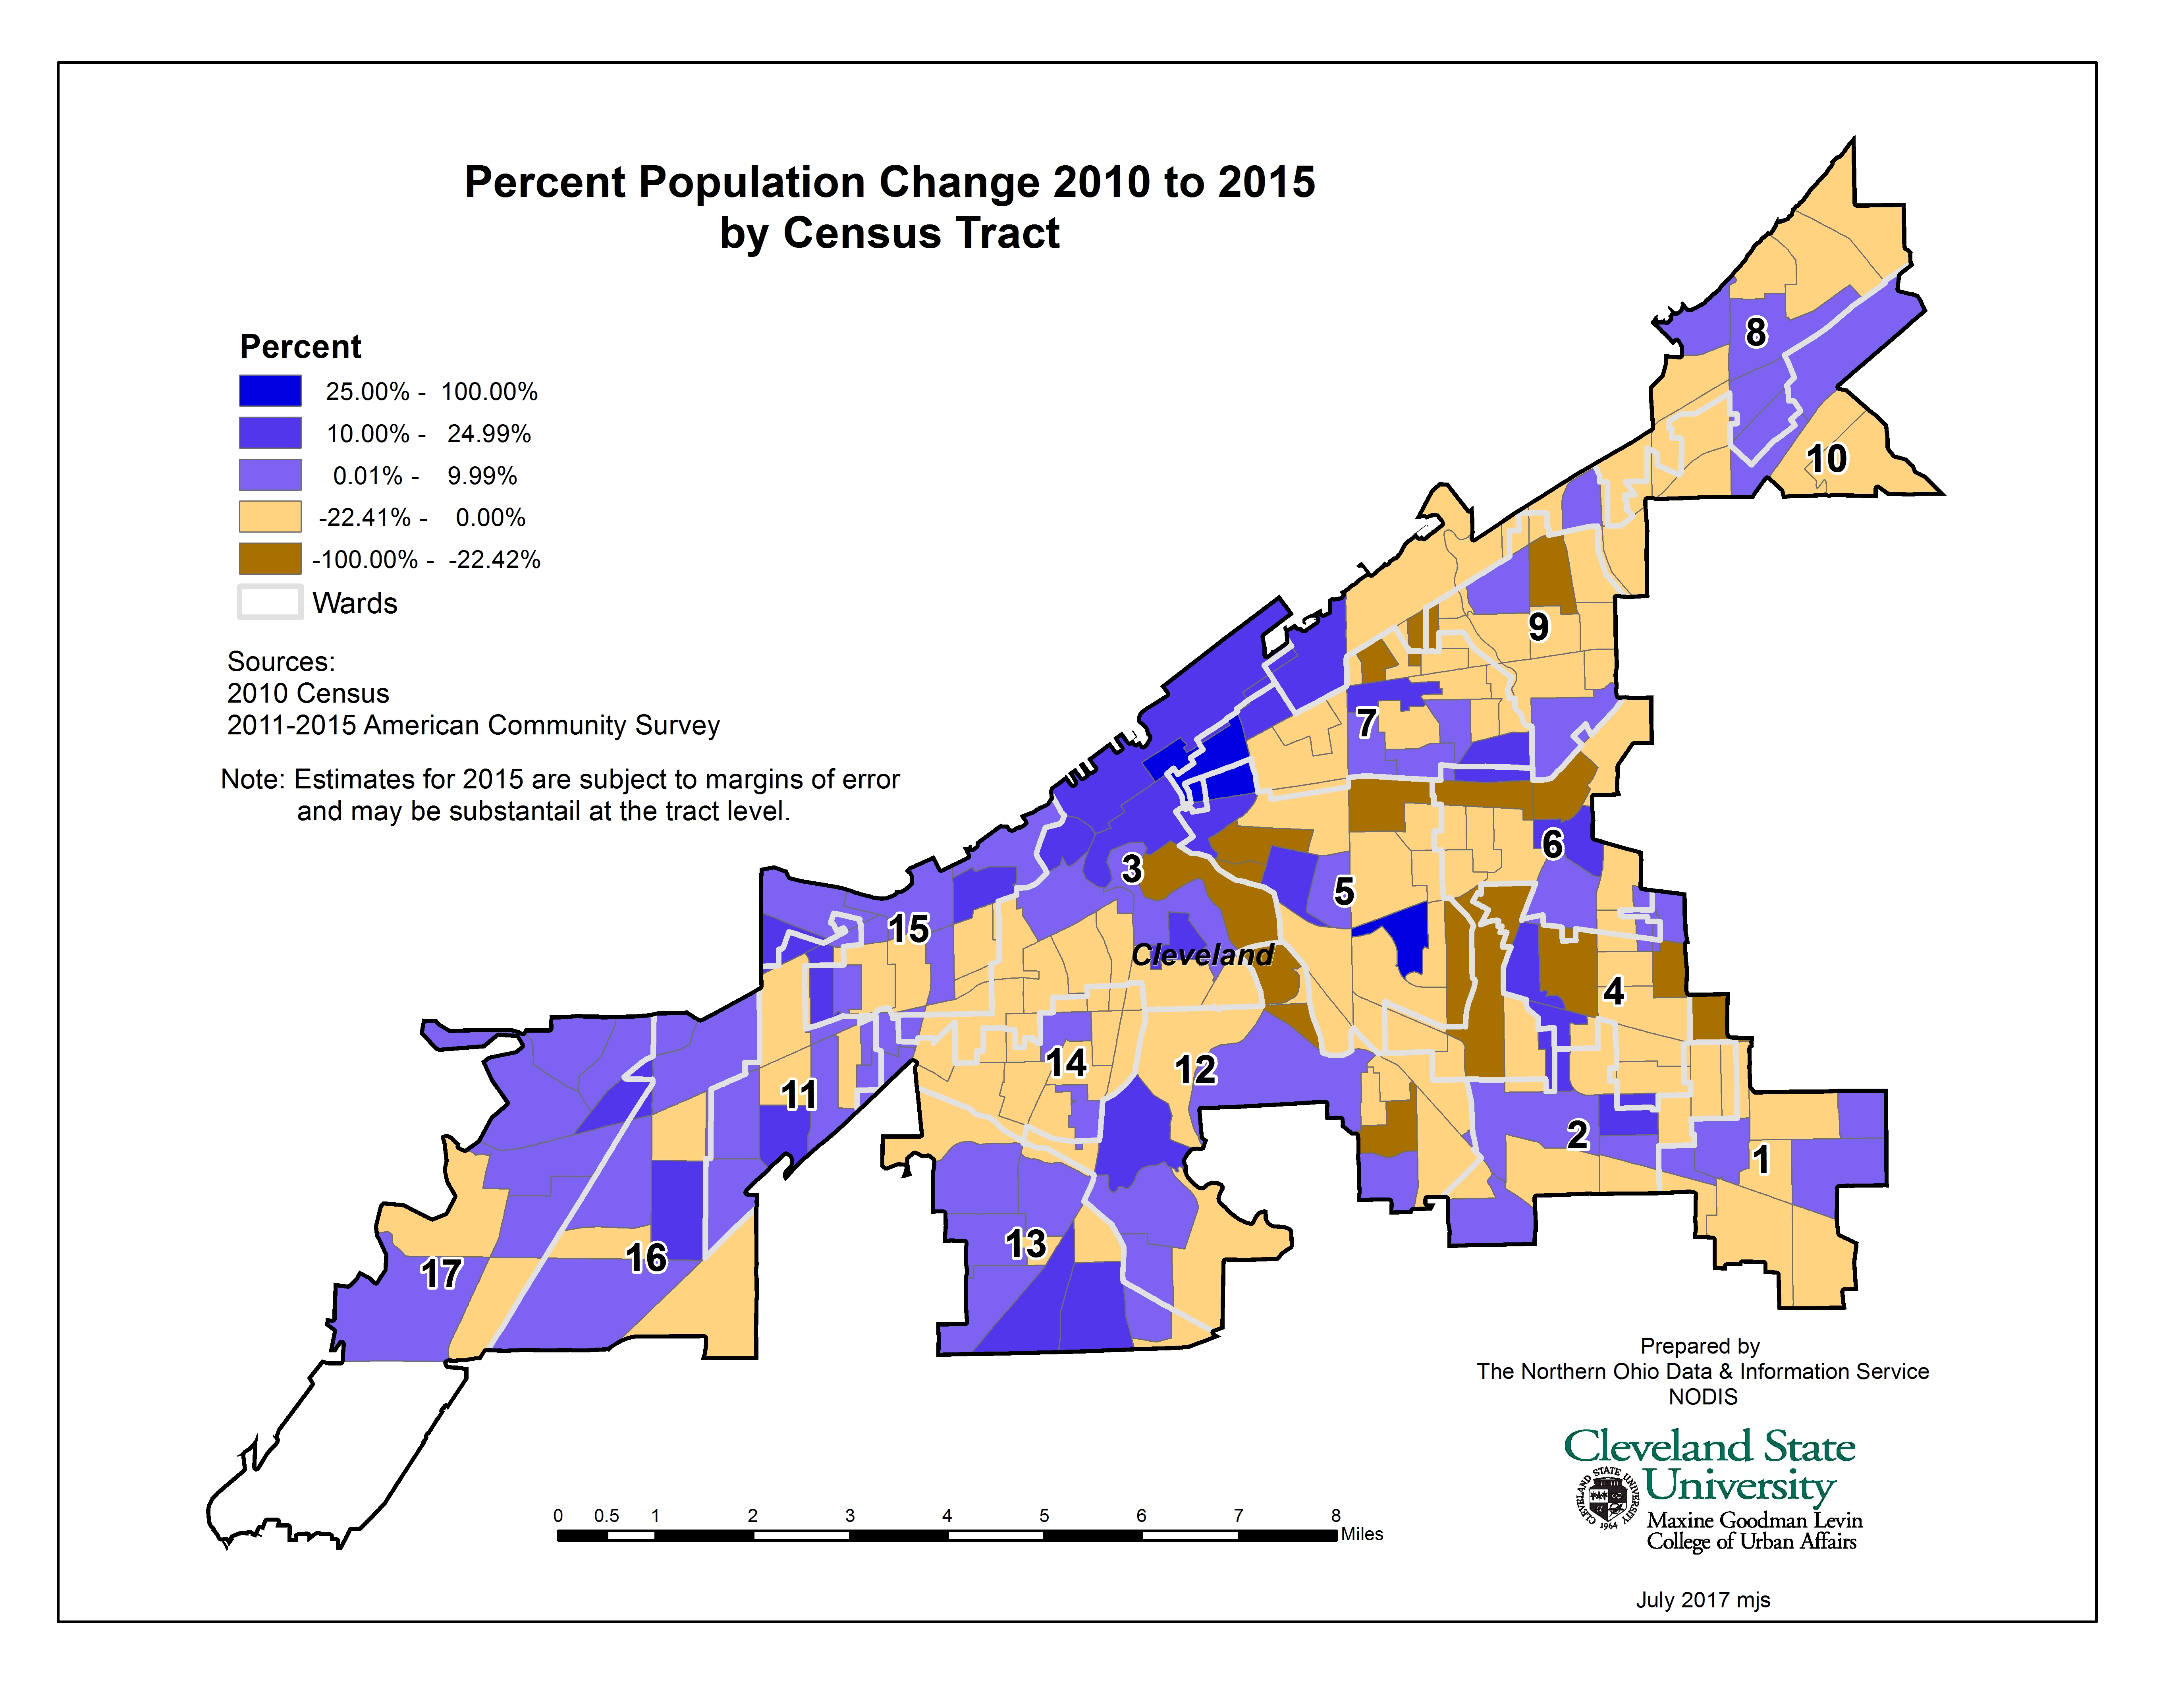 |
| Percent Population Change 2010 to 2015 by Census Block Group | 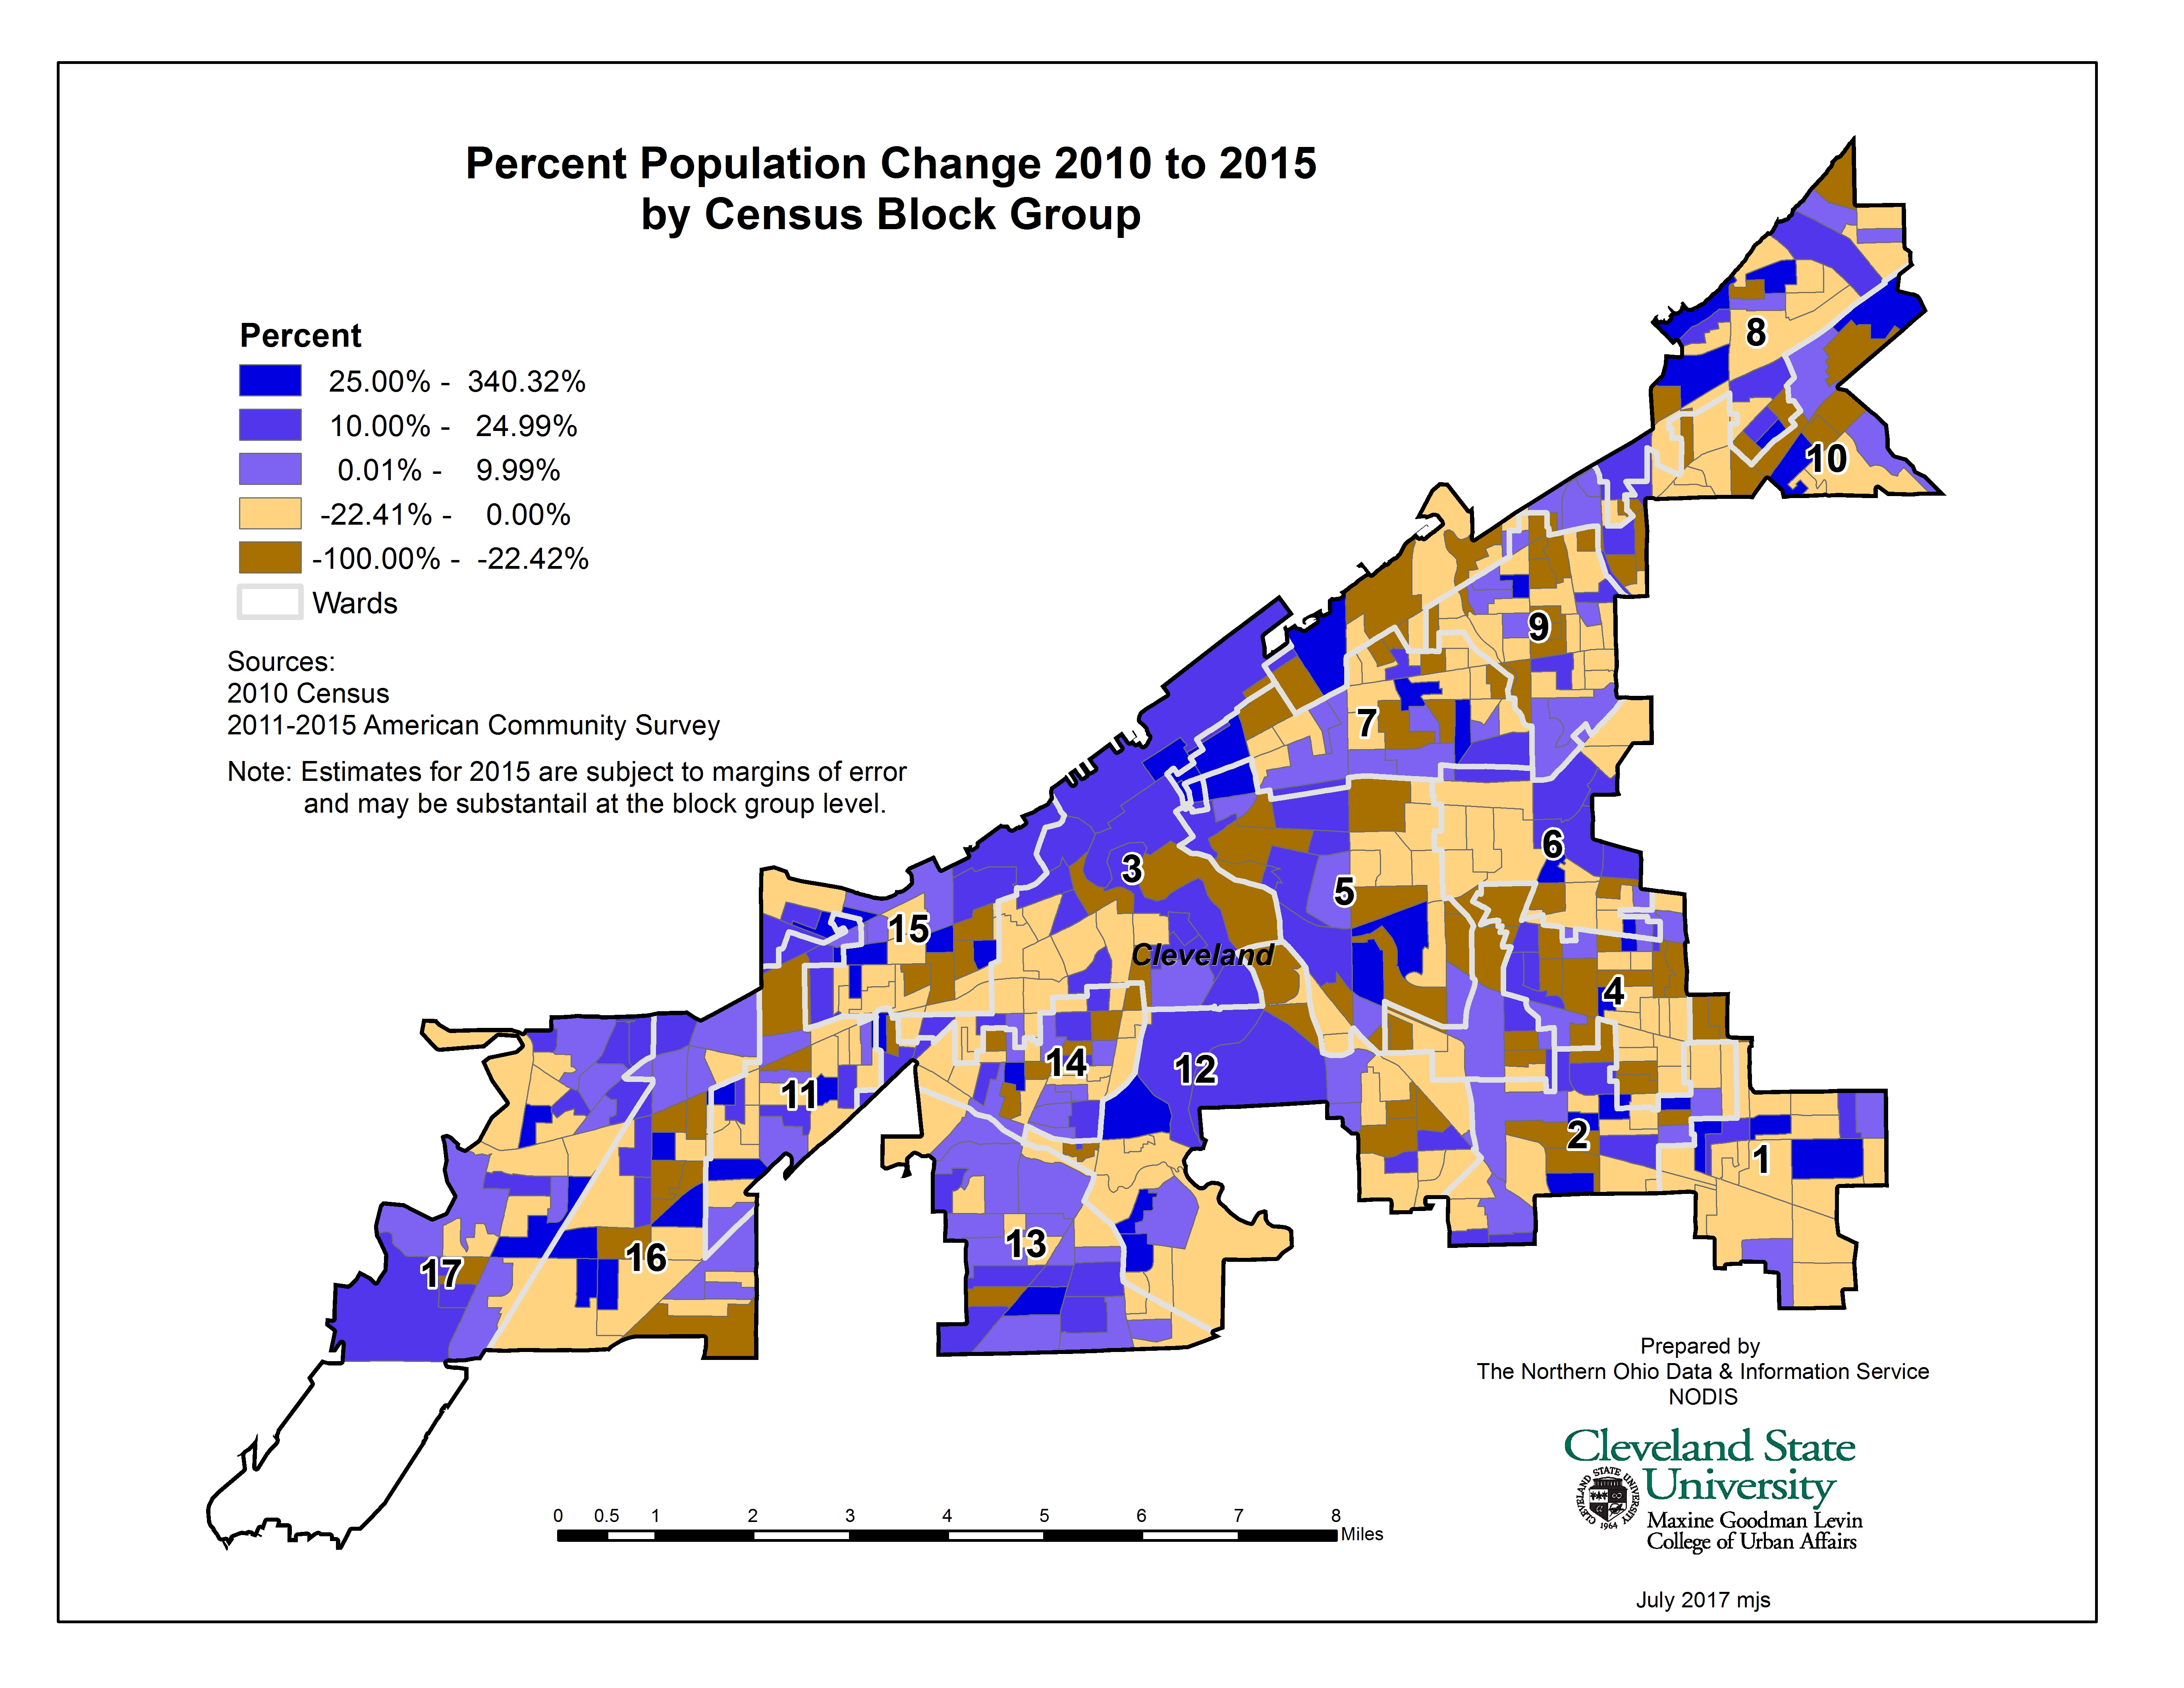 |
Percent Below Poverty in Cleveland and Vicinity | 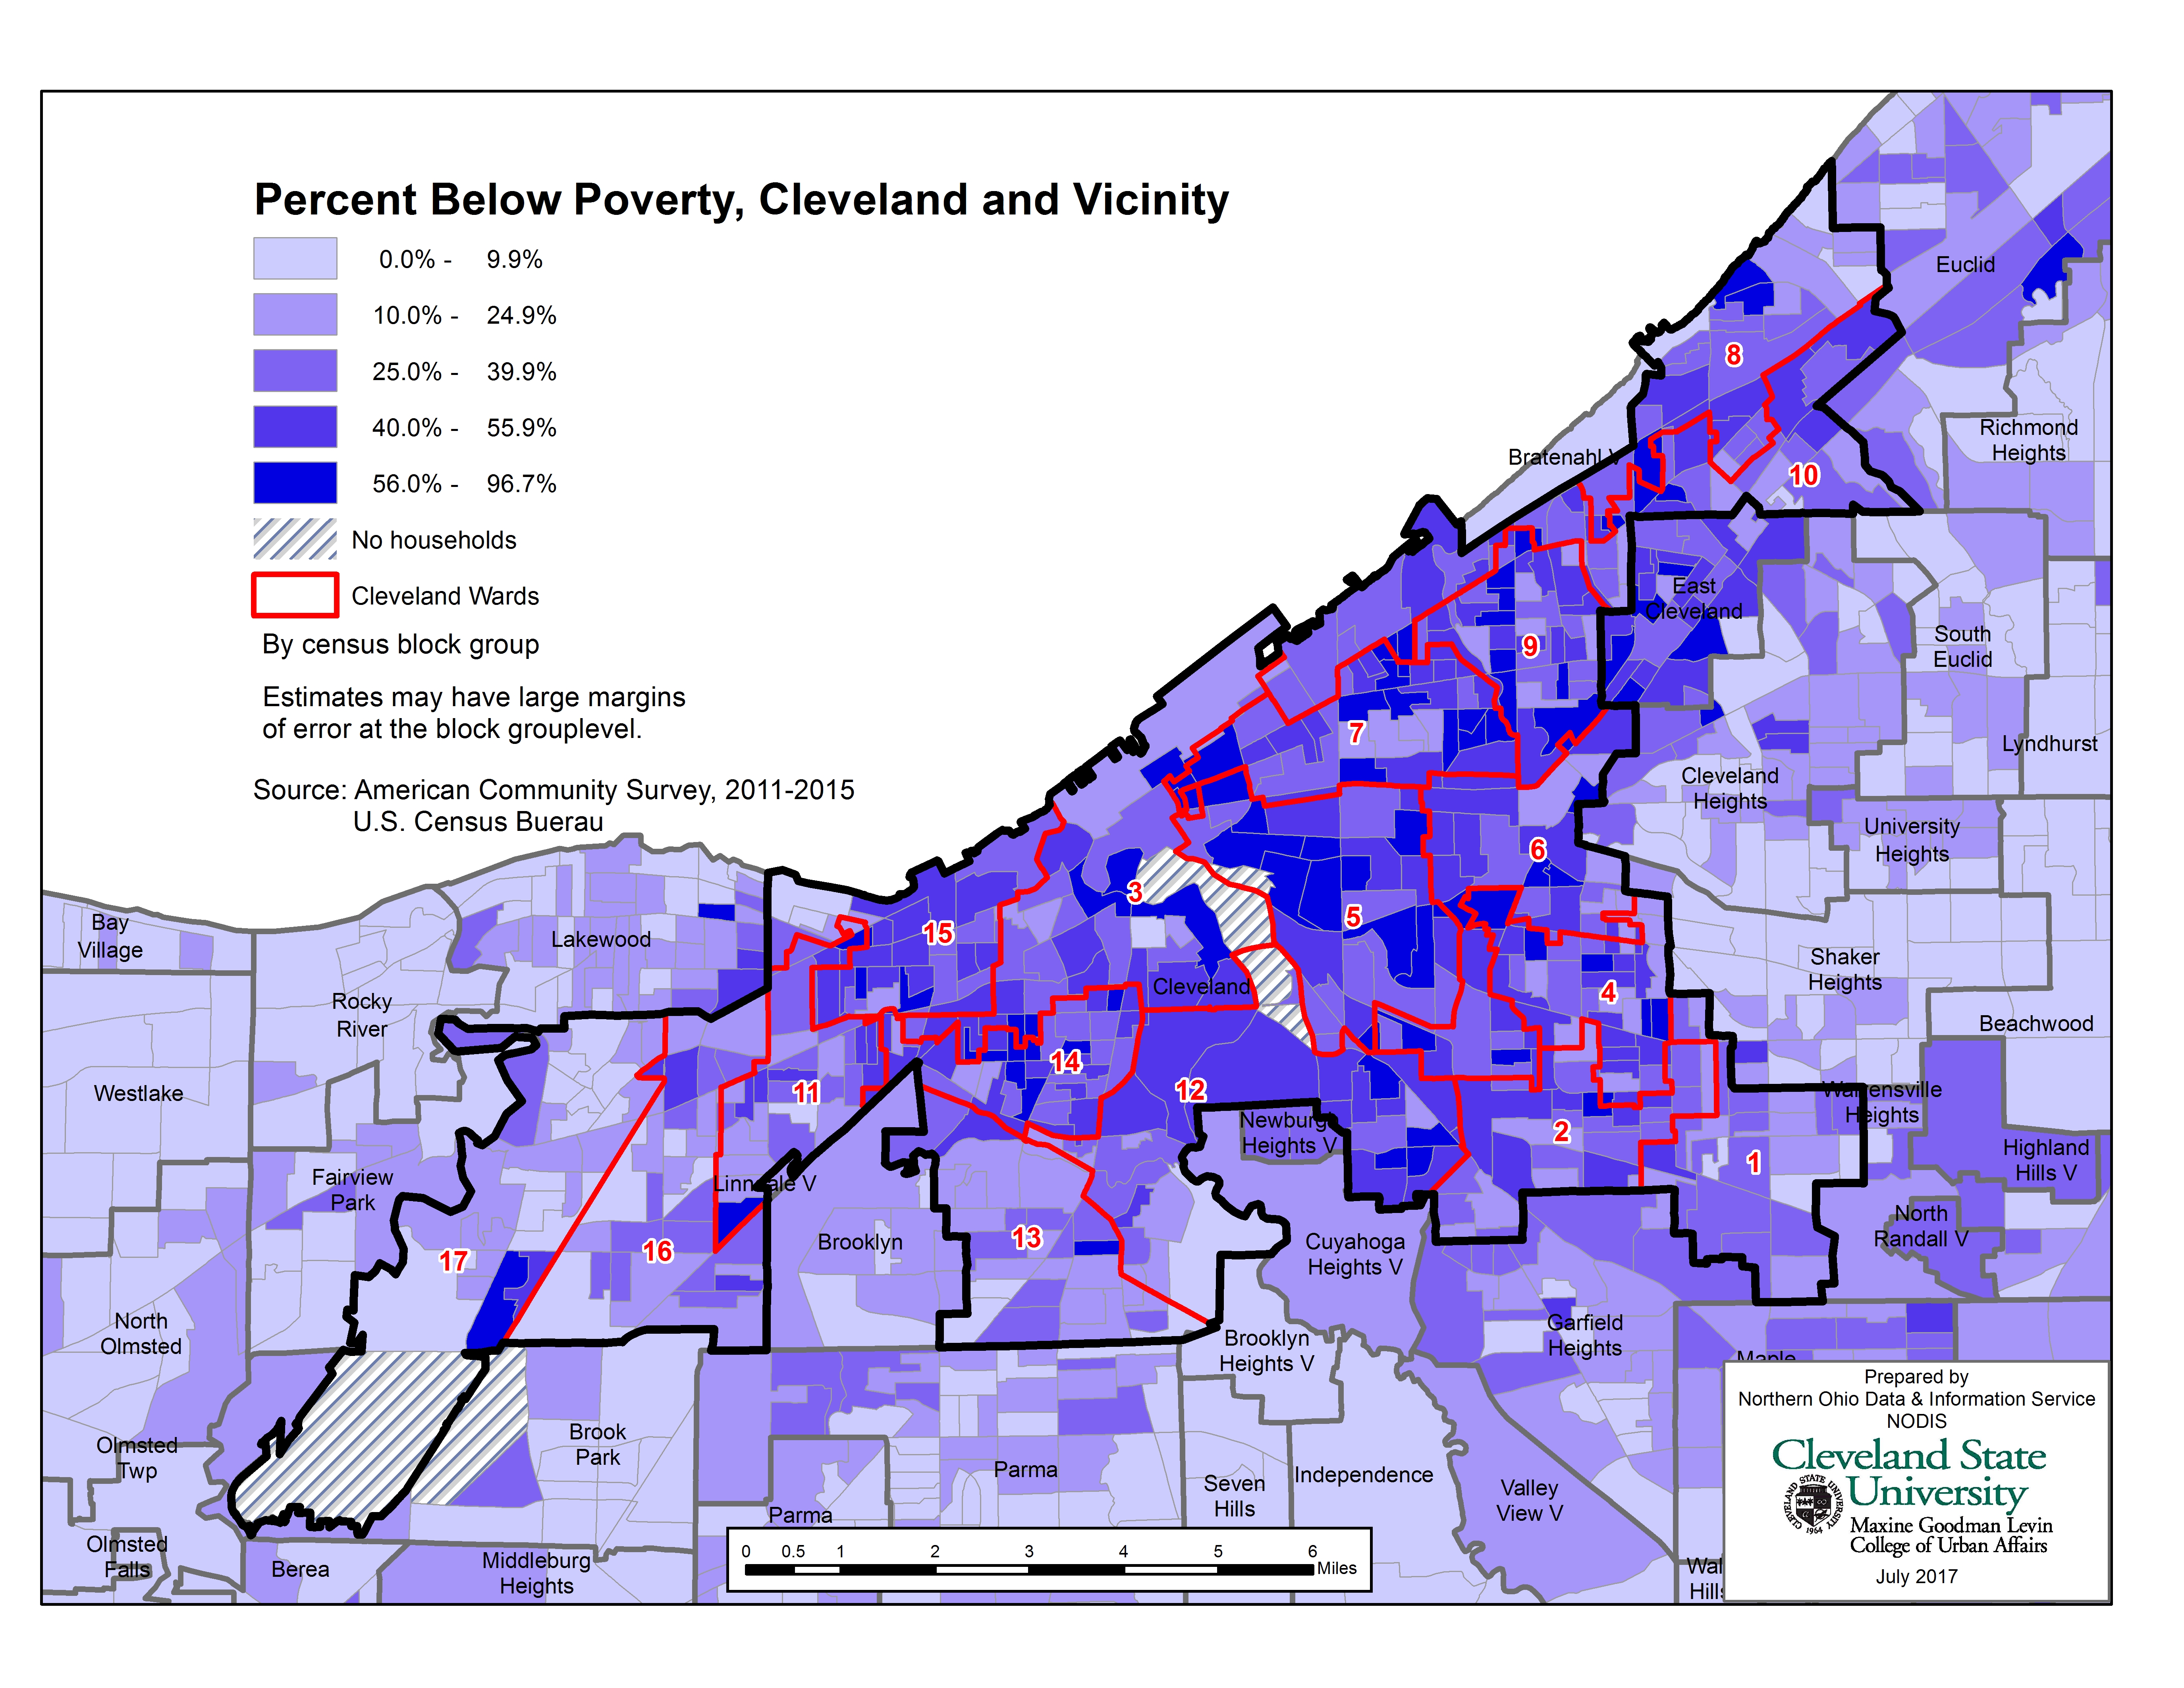 |
| Auditor's 2015 Property Valuation per Square Foot by Census Block (Value per square foot aggregated to blocks) | 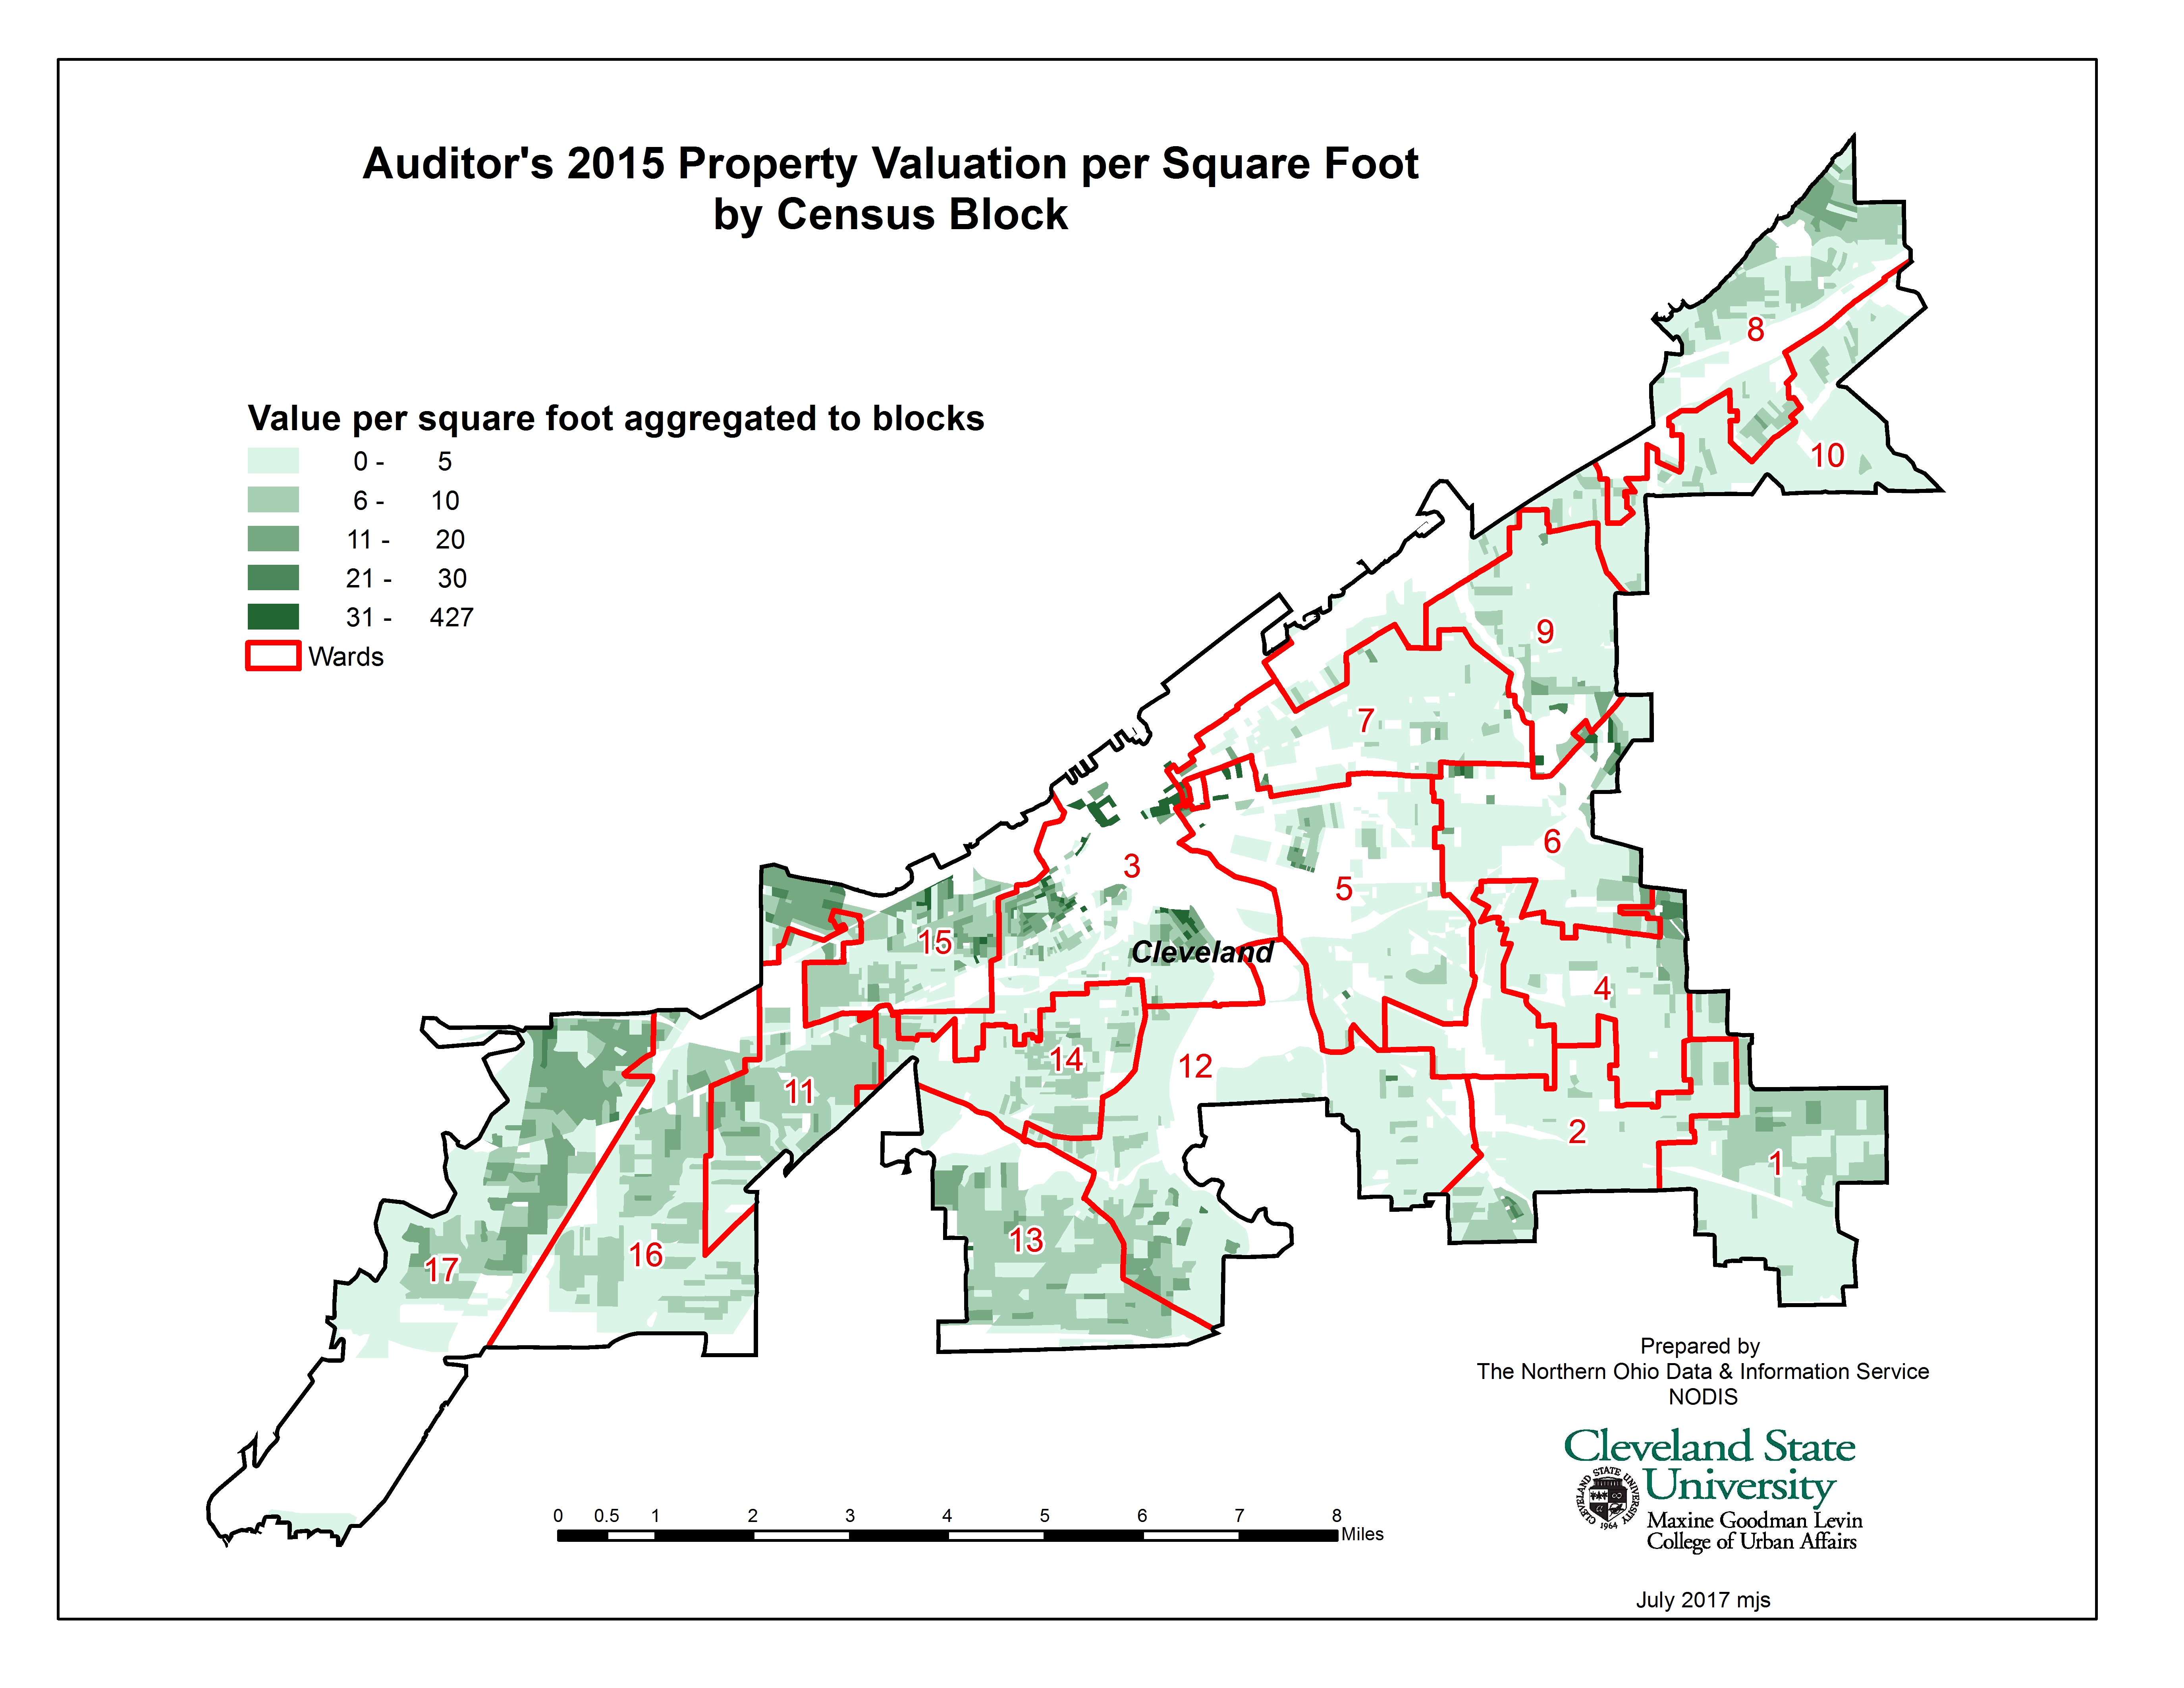 |
Auditor's 2015 Property Valuation per Square Foot by Census Block (Value per square foot by ward) | 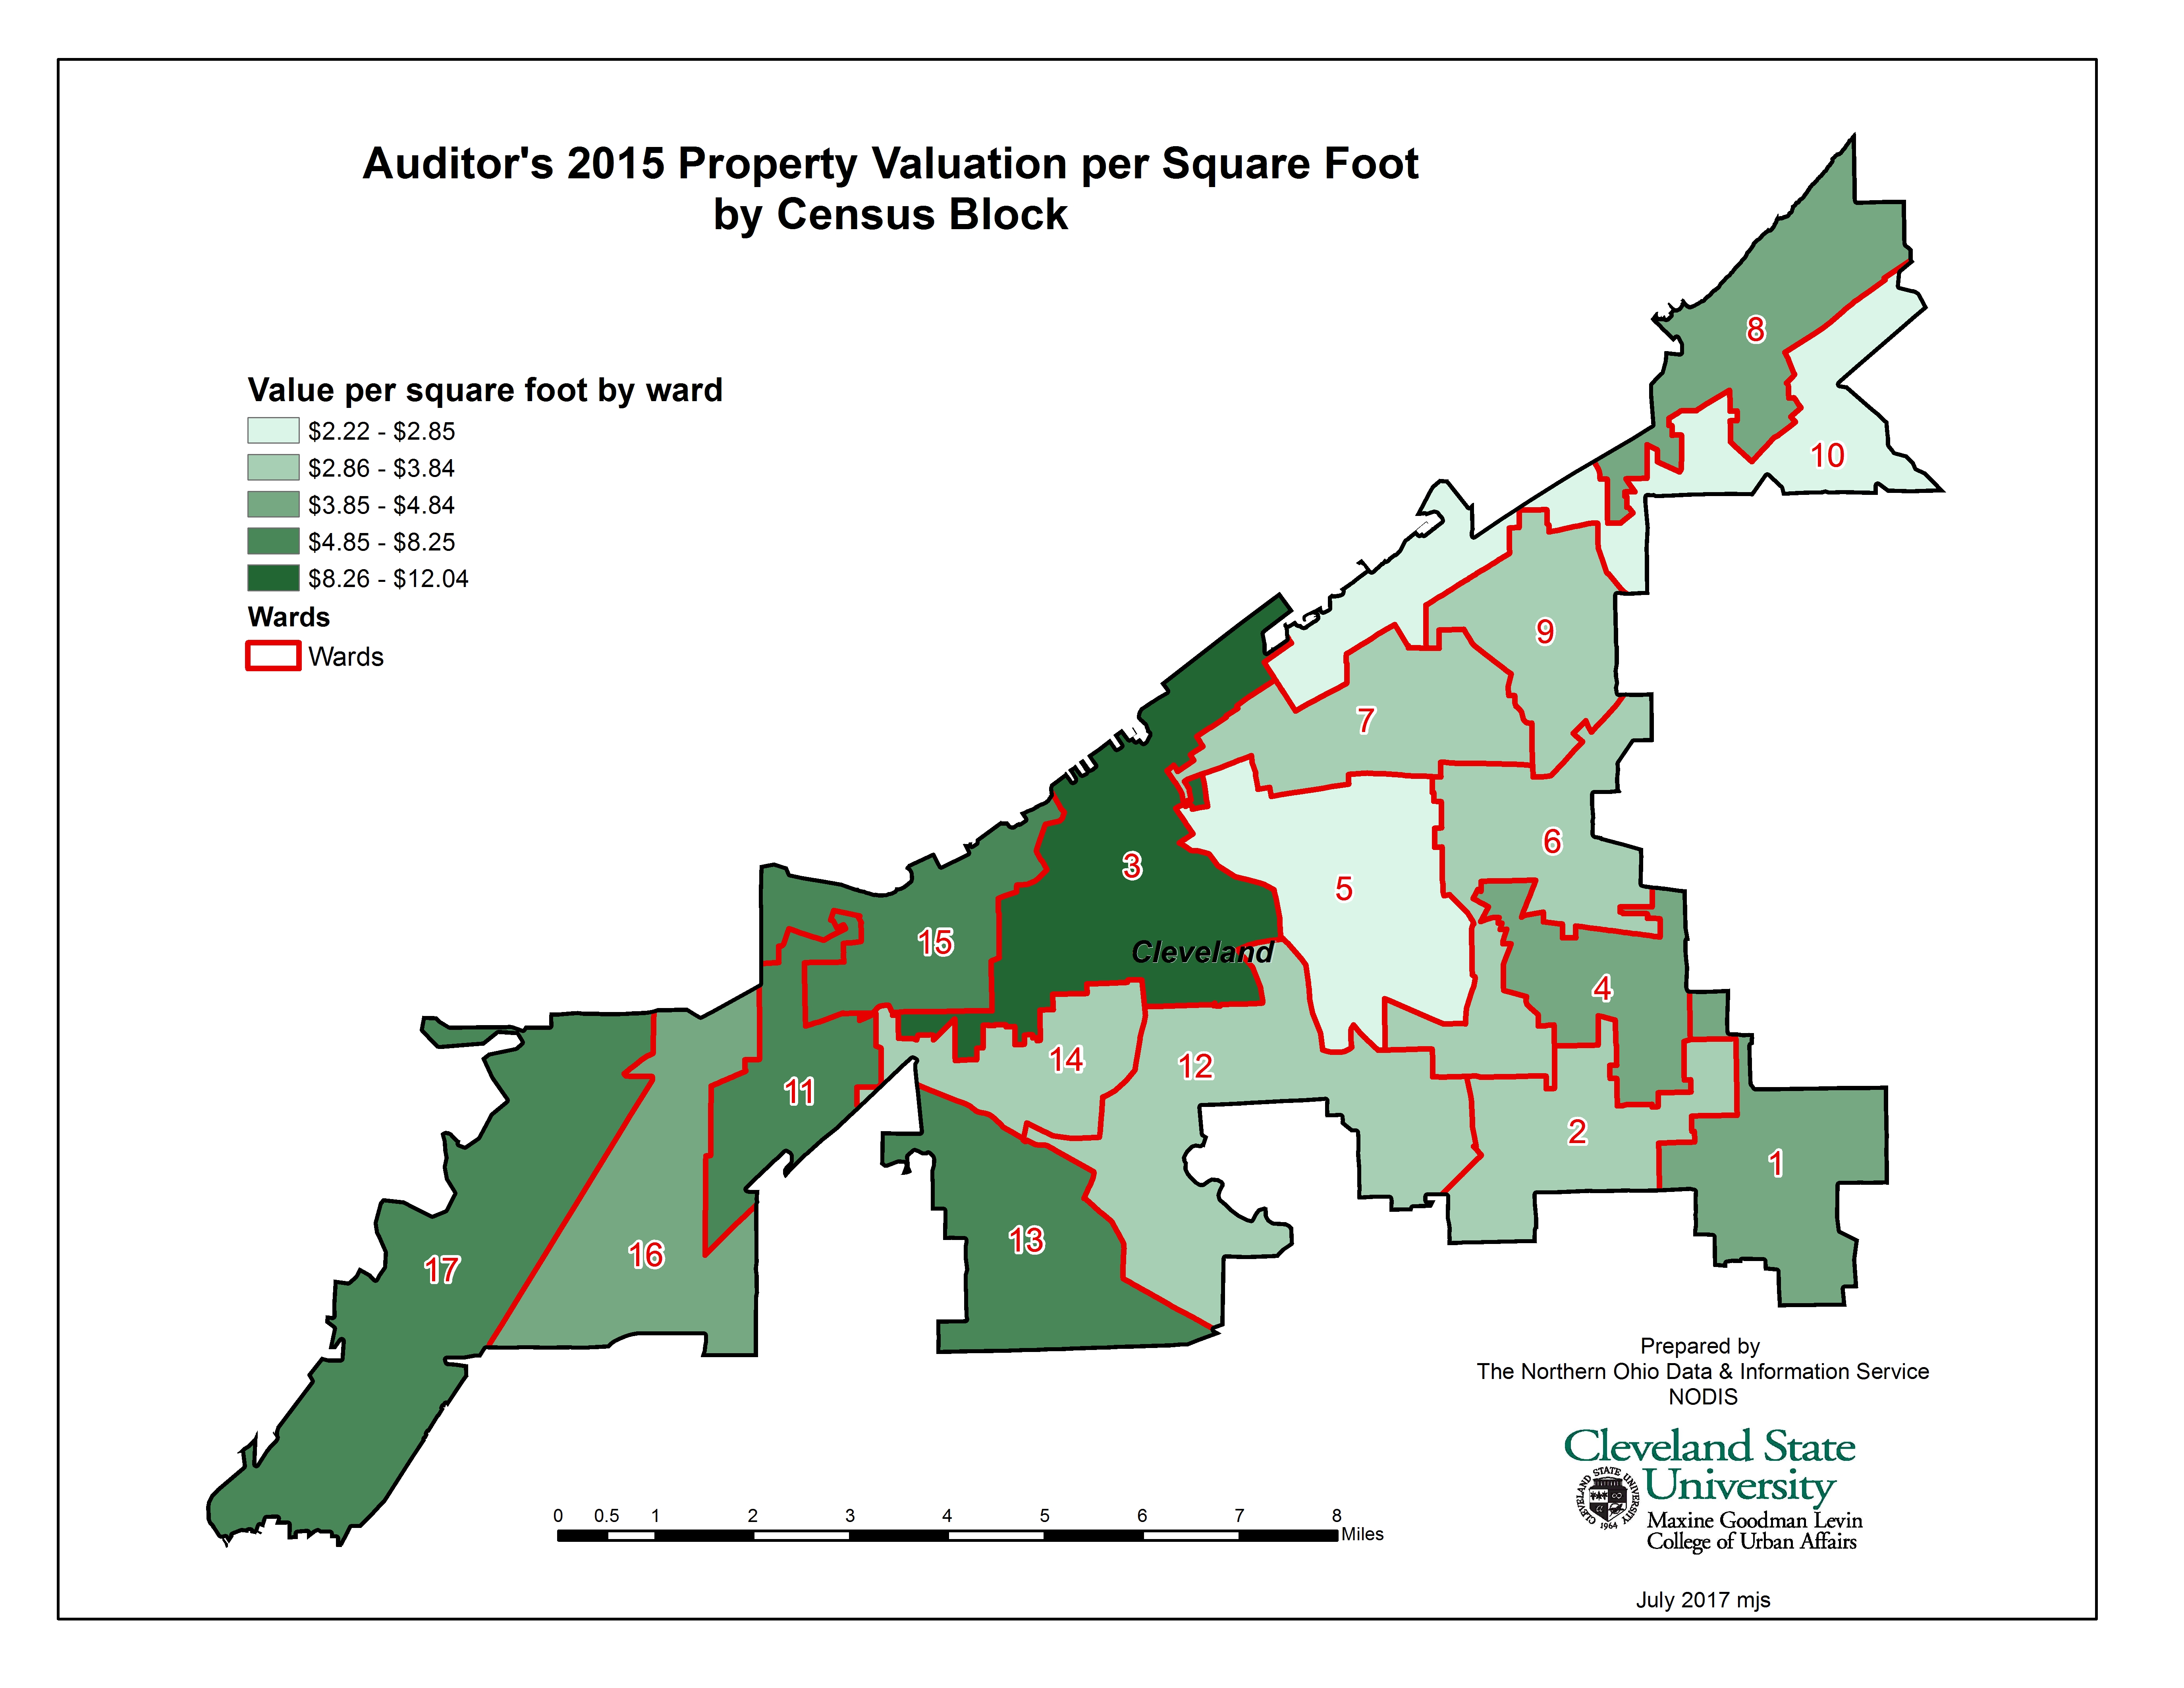 |
| Community Boudaries, 2004, Cuyahoga County |  |
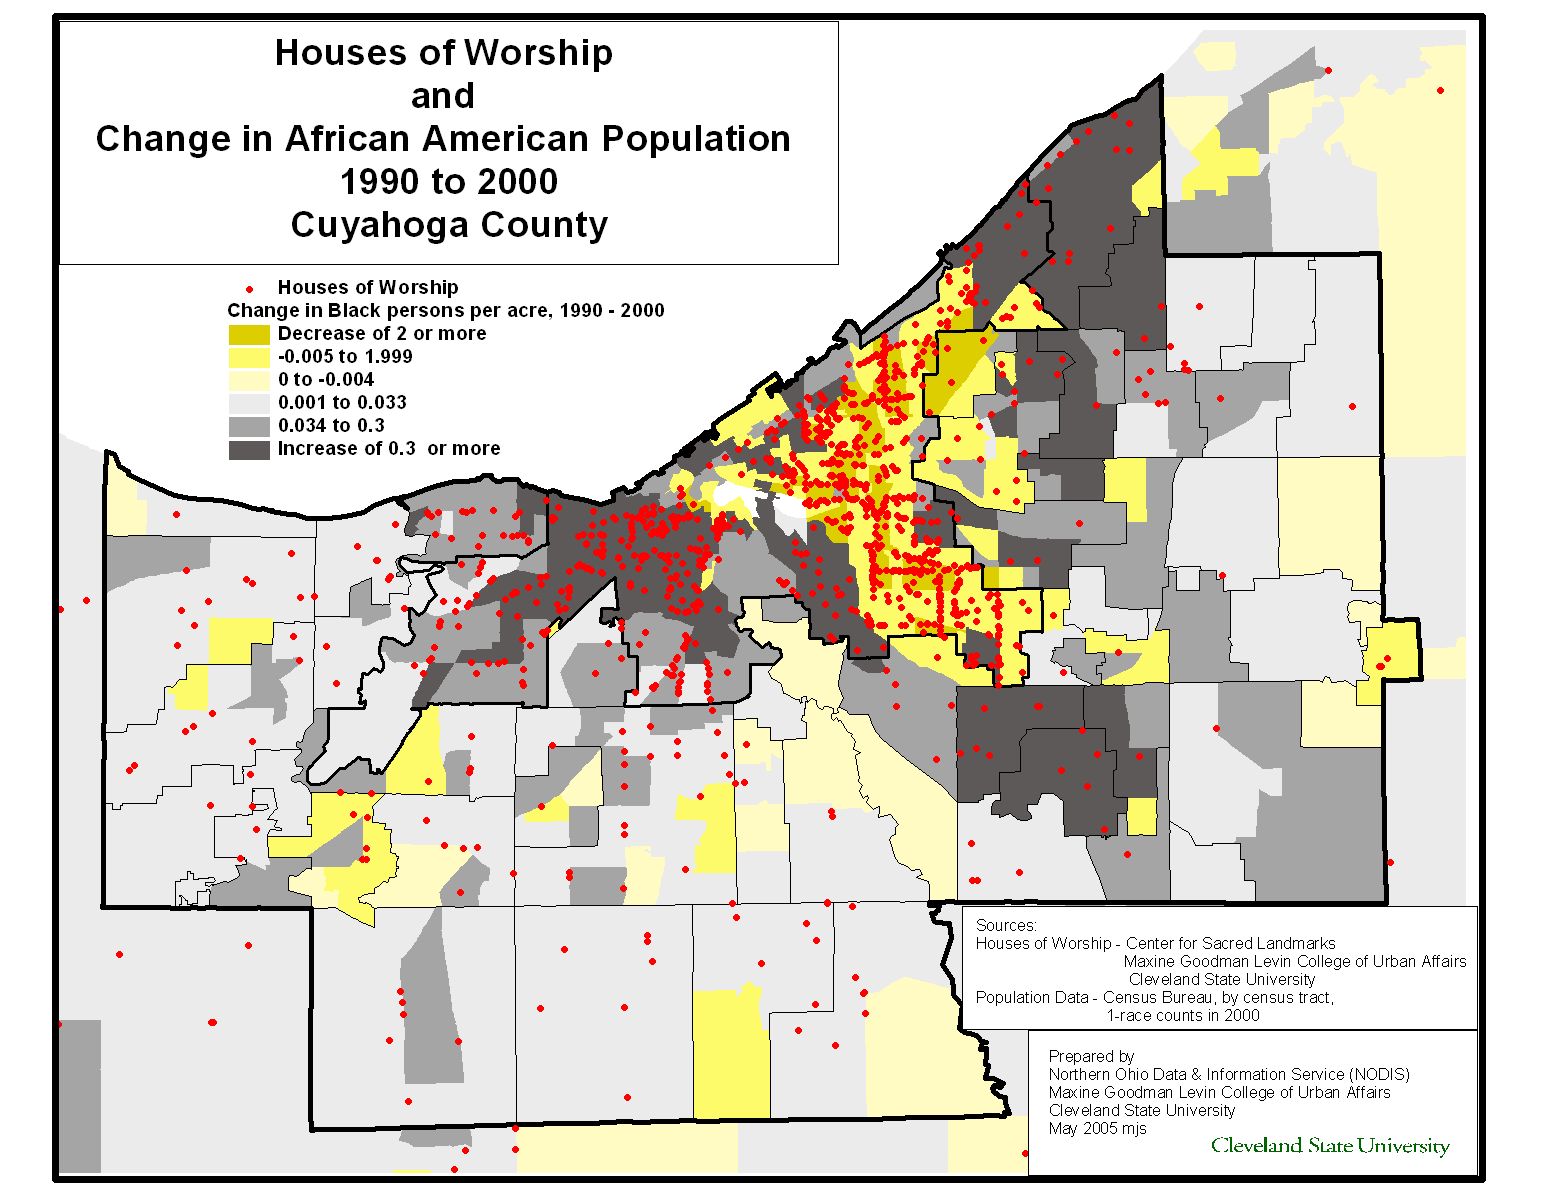
Houses of Worship and Change in African American Population 1990 to 2000: Cuyahoga County |
 |
|
Zip Code Boundaries 2000 for Cuyahoga County and Adjacent Counties Showing City Boundaries, Roads & County Boundaries 2000 |
 |
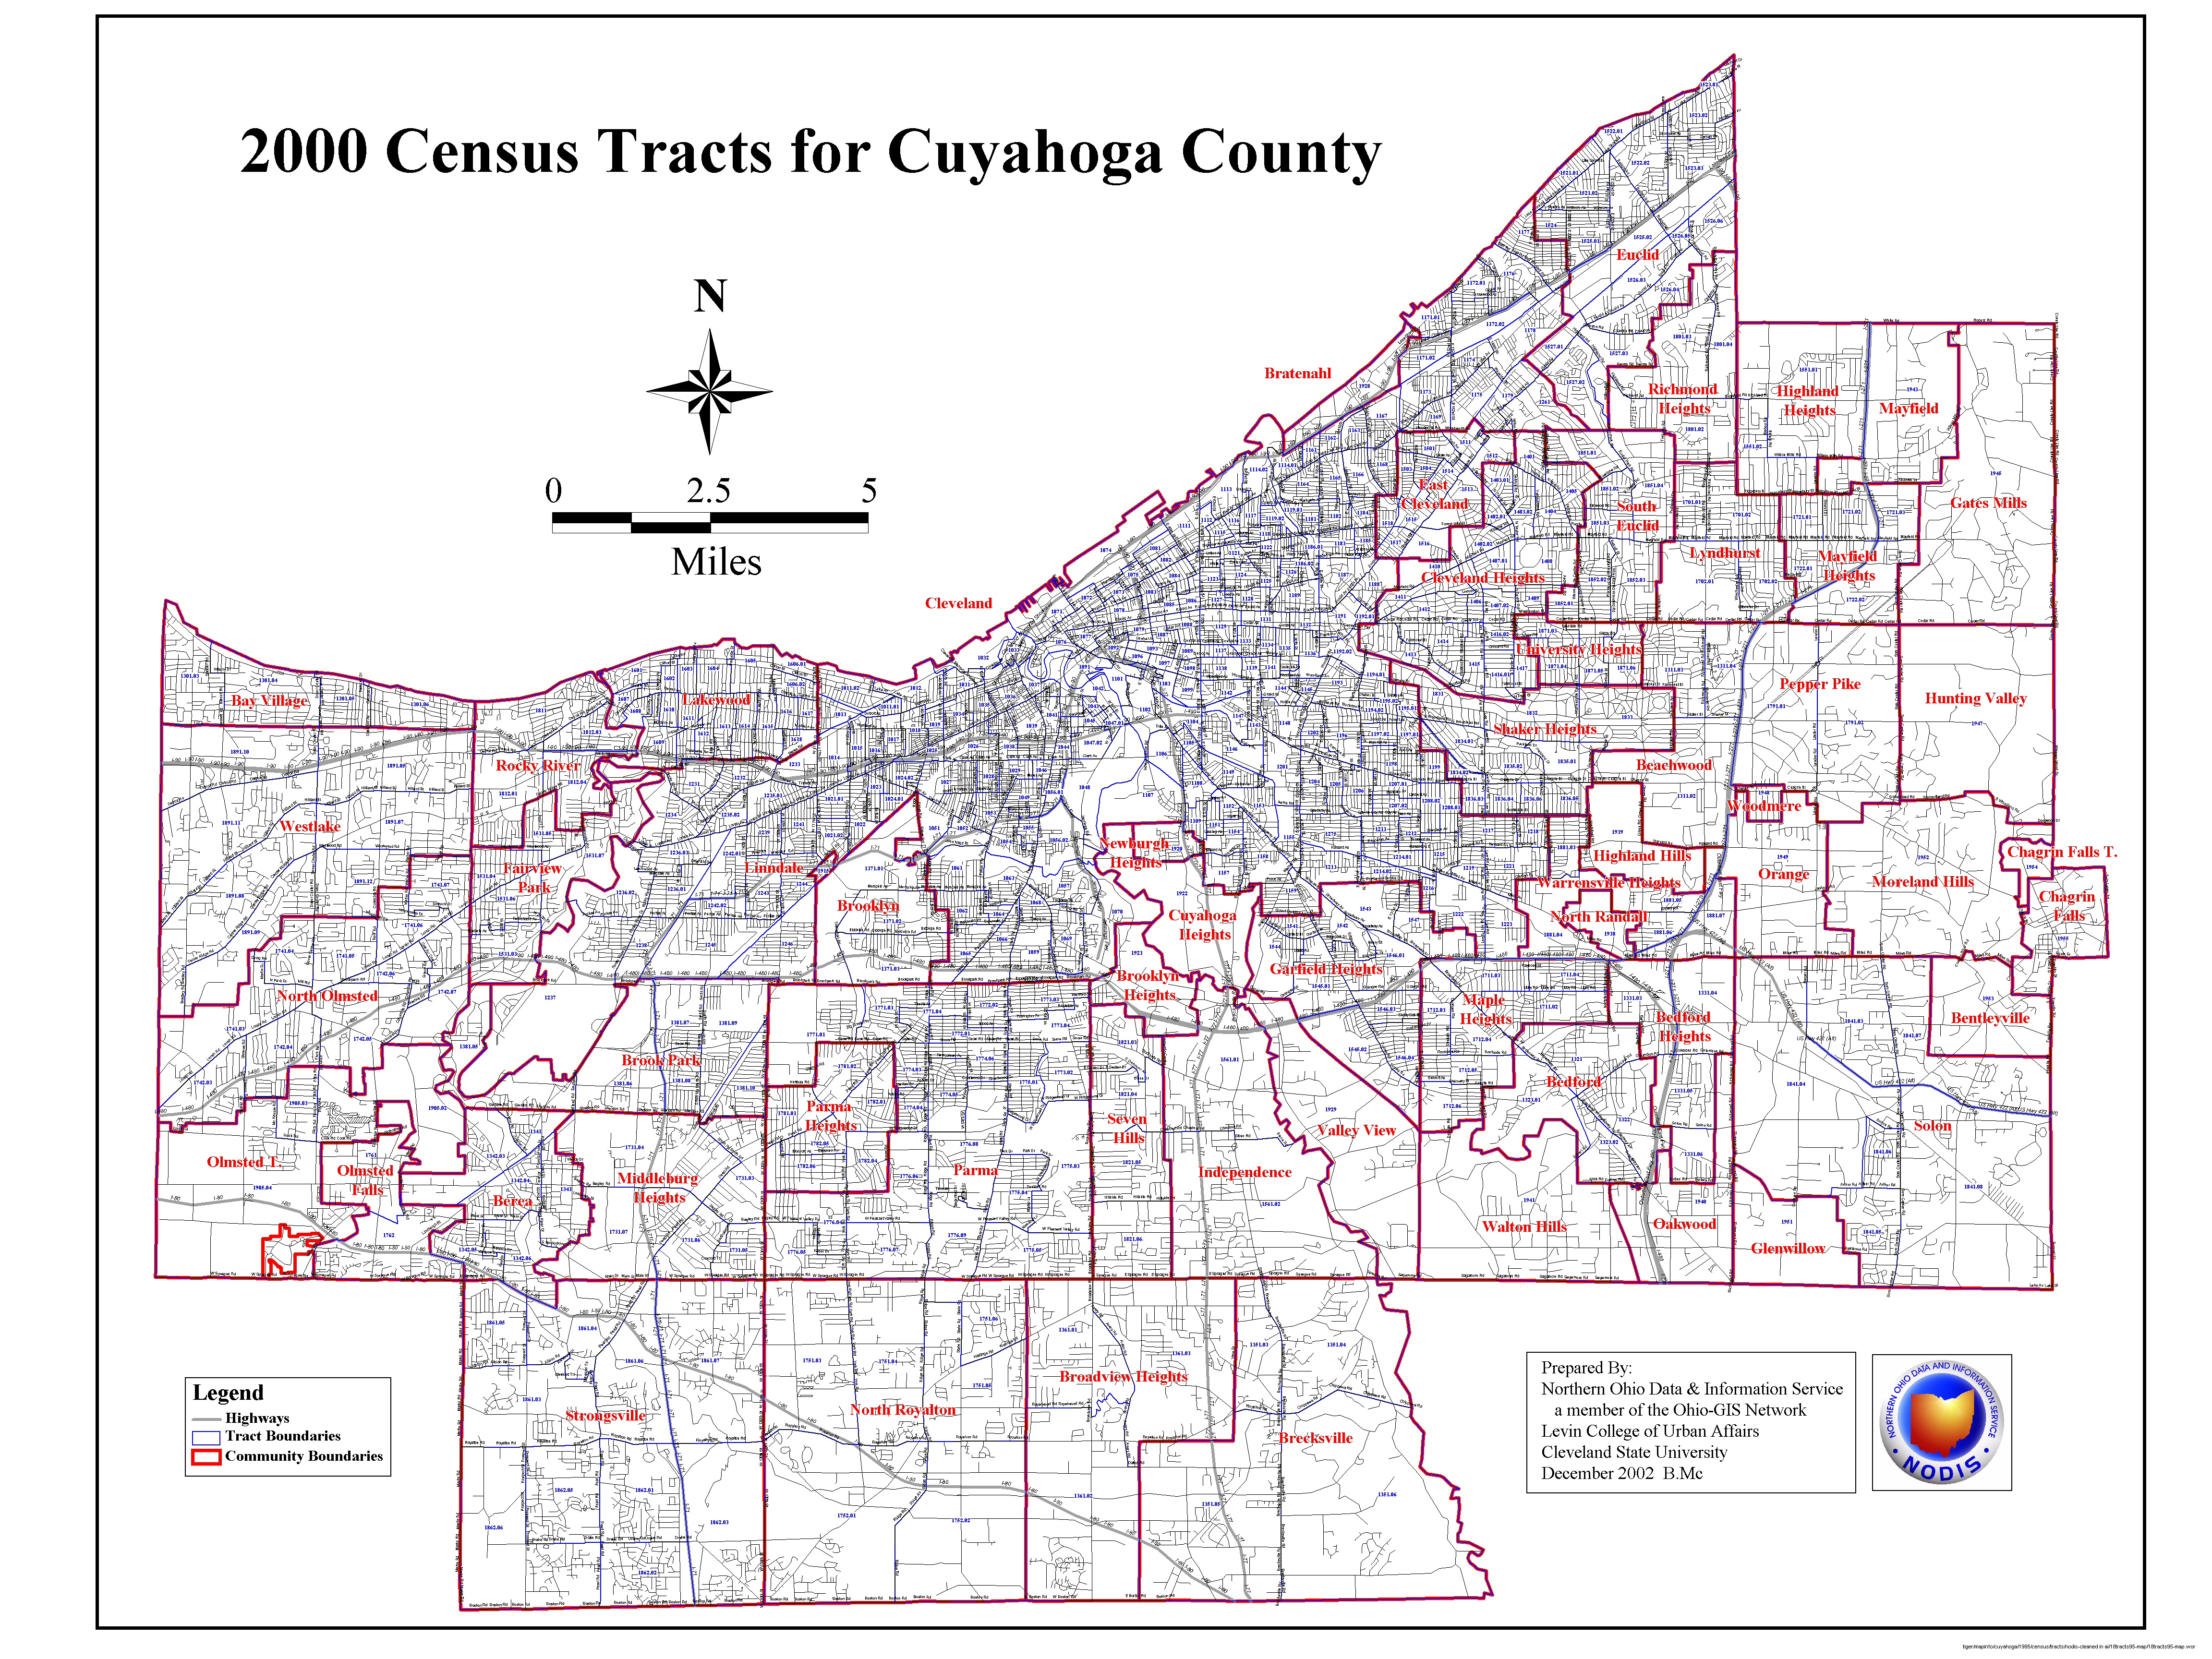
Census Tract Map for Cuyahoga County Click here for PDF version Note: This map is very large & may not be viewable on PCs with old browsers/less memory |
 |
| Median Household Income in Cuyahoga County | 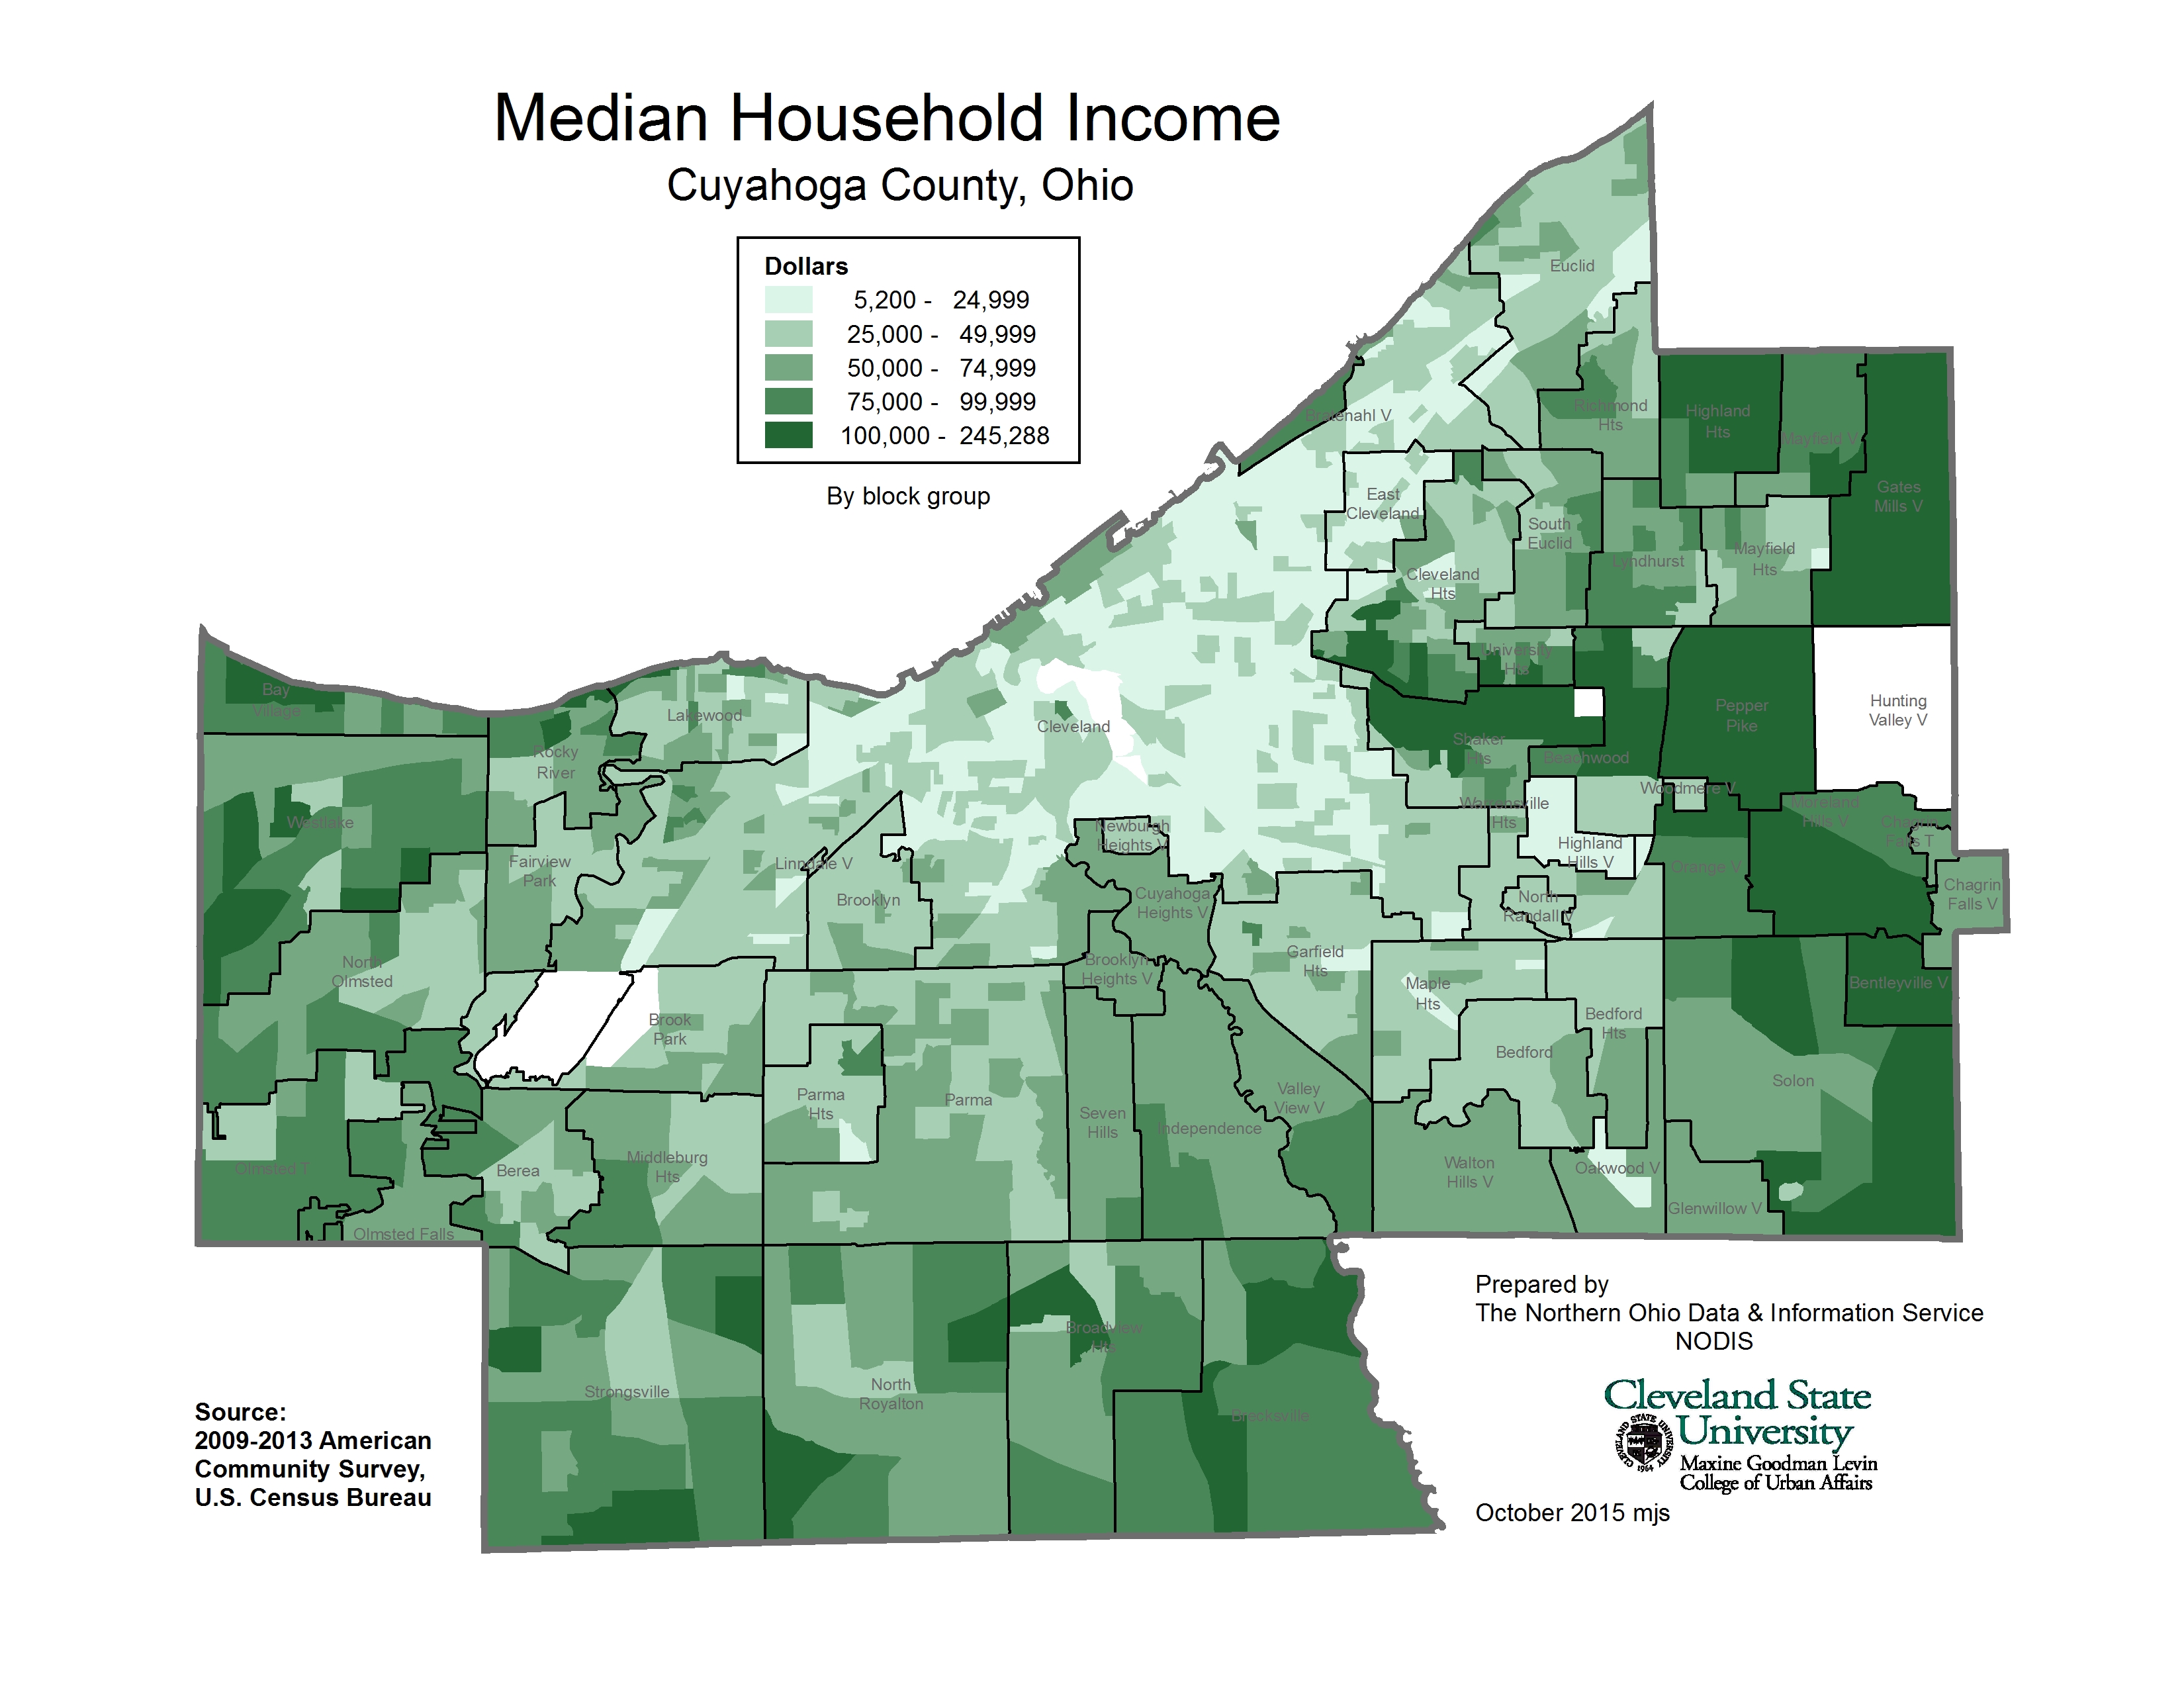 |
Early In Person Votes in the 2012 General Election and Percent African American Voting Age Population 2010 Census |
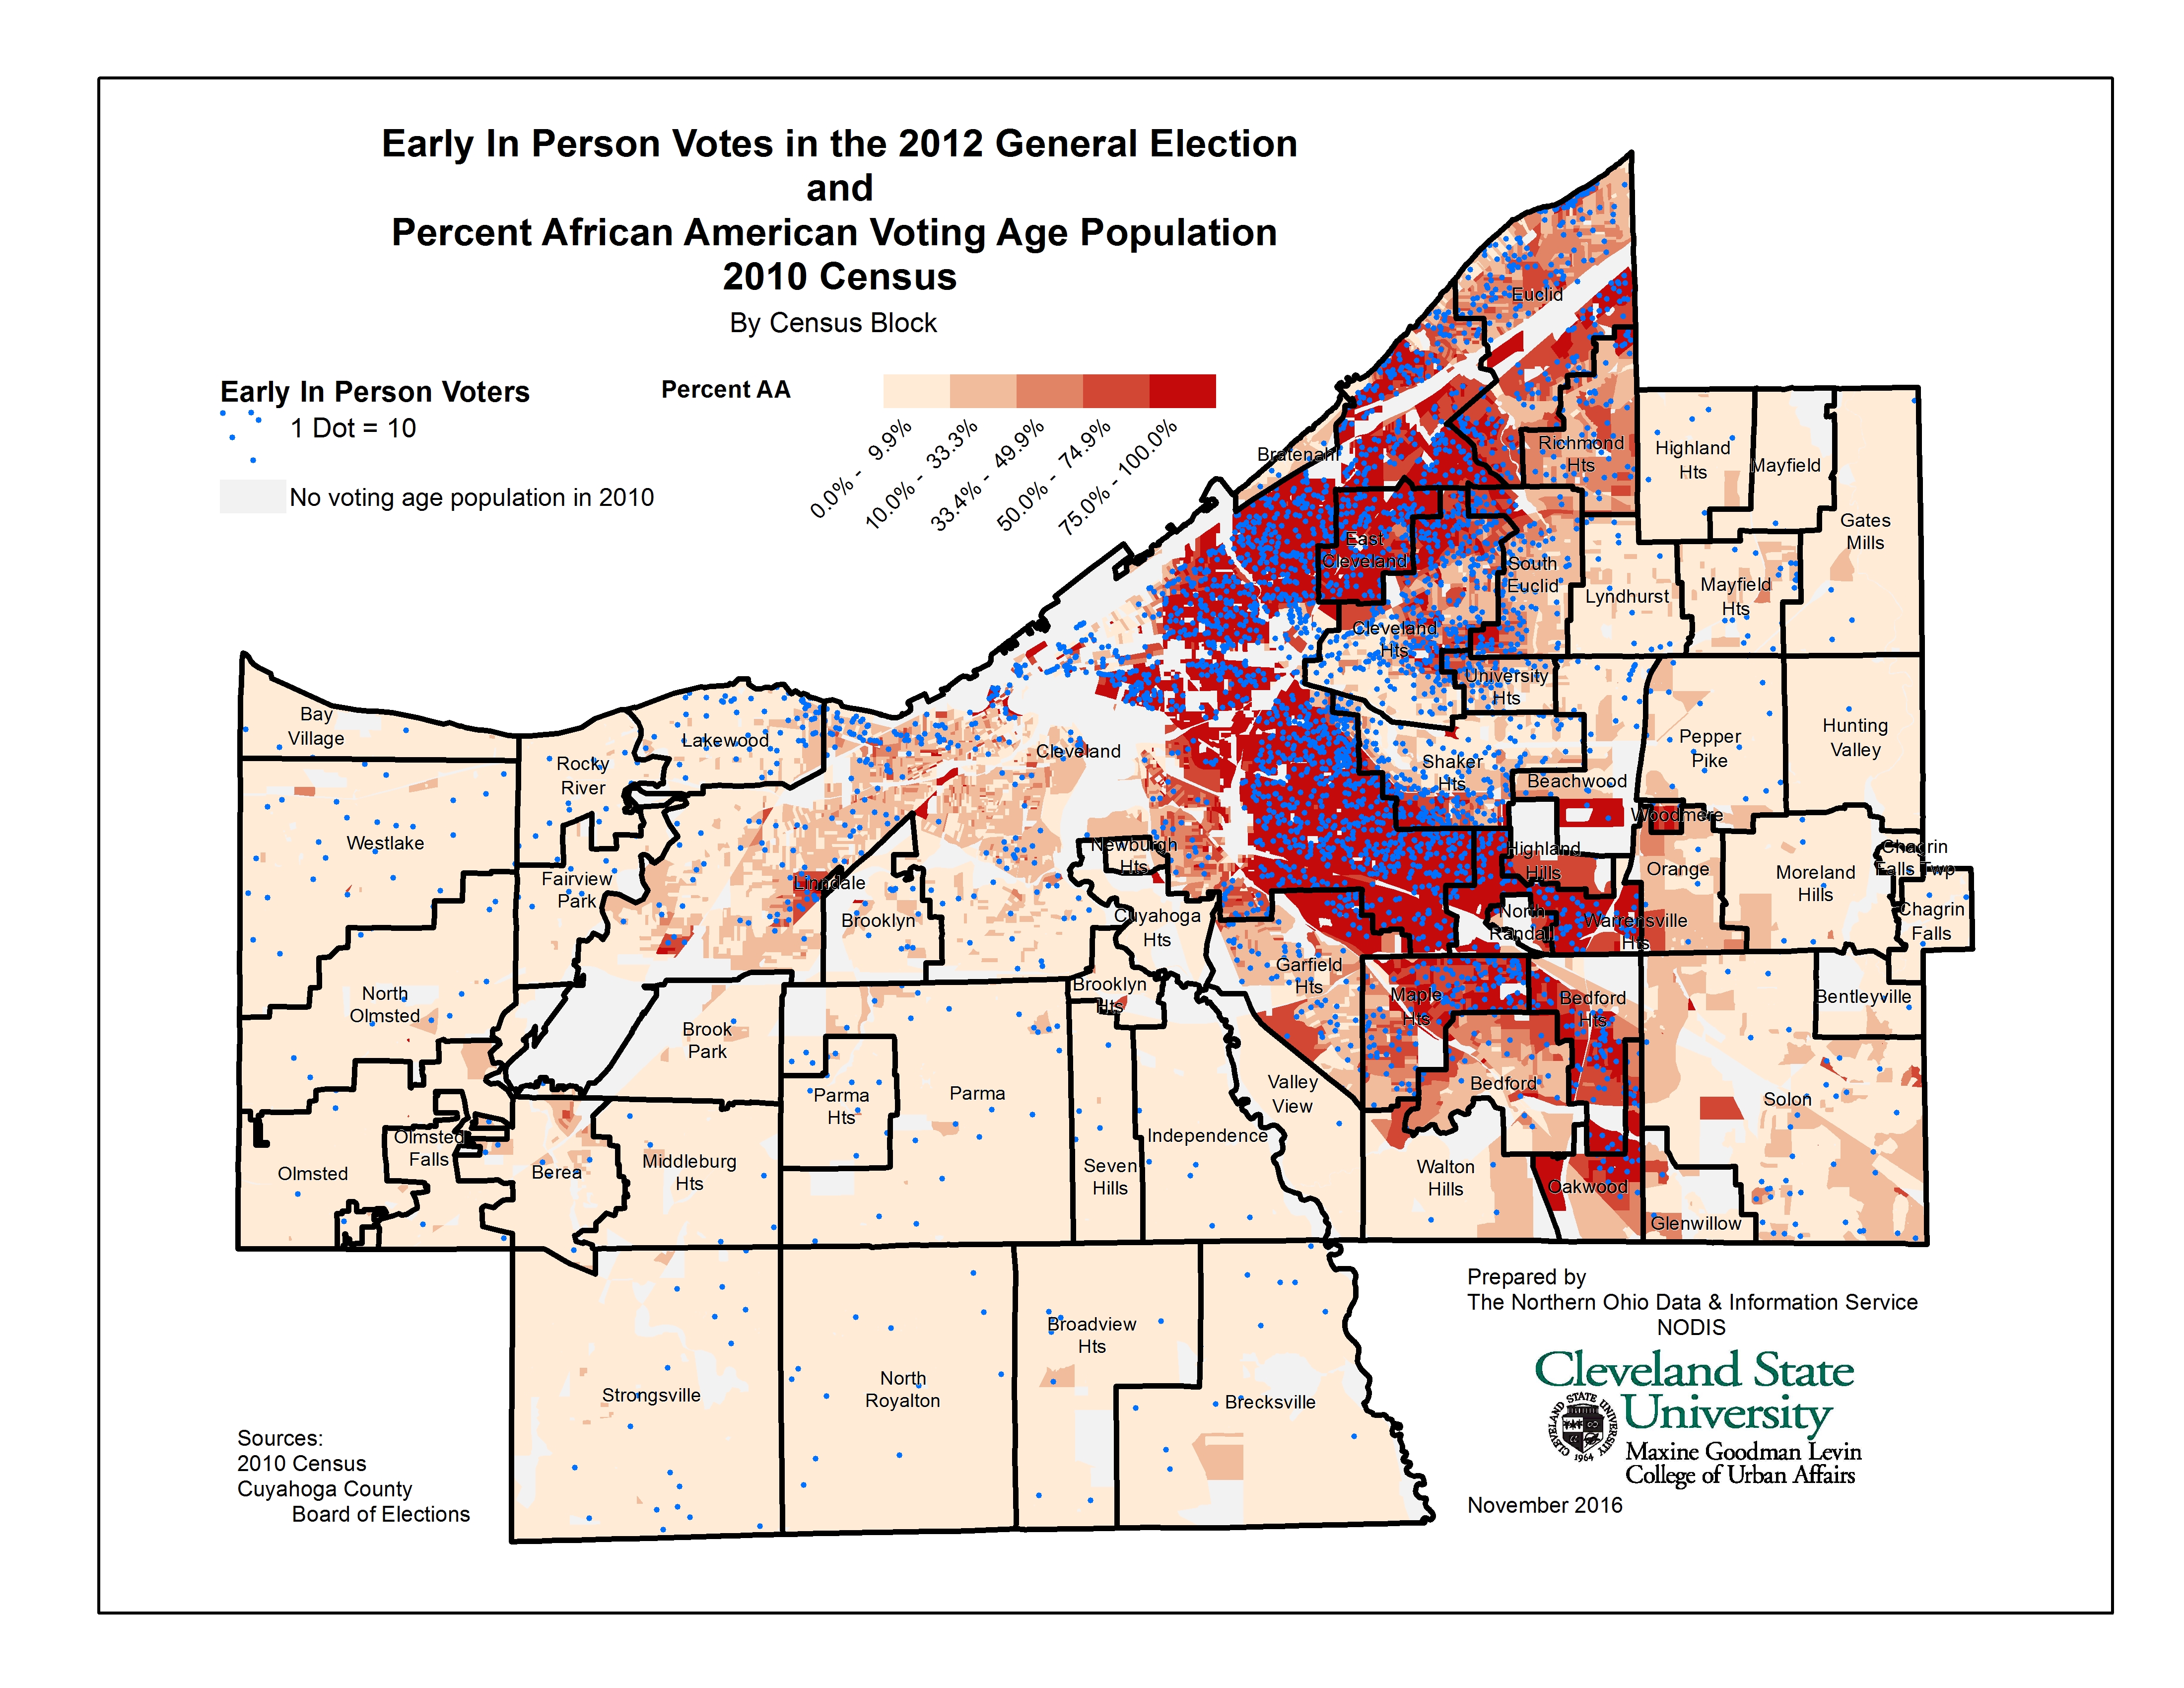 |
| Region Percent Uninsured, 2009-2013 |  |
Region Percent Uninsured, 2011-2015 |
 |
| Top 10 Places of Origin from which the Foreign Born Moved to the United States |  |
Probable Heroin and Fentanyl Deaths in 2016 and Q1 of 2017 |
 |
| Percent of Registered Voters Voting in 2016 Presidential Election and African American and Hispanic/Latino Persons 18 and Older | 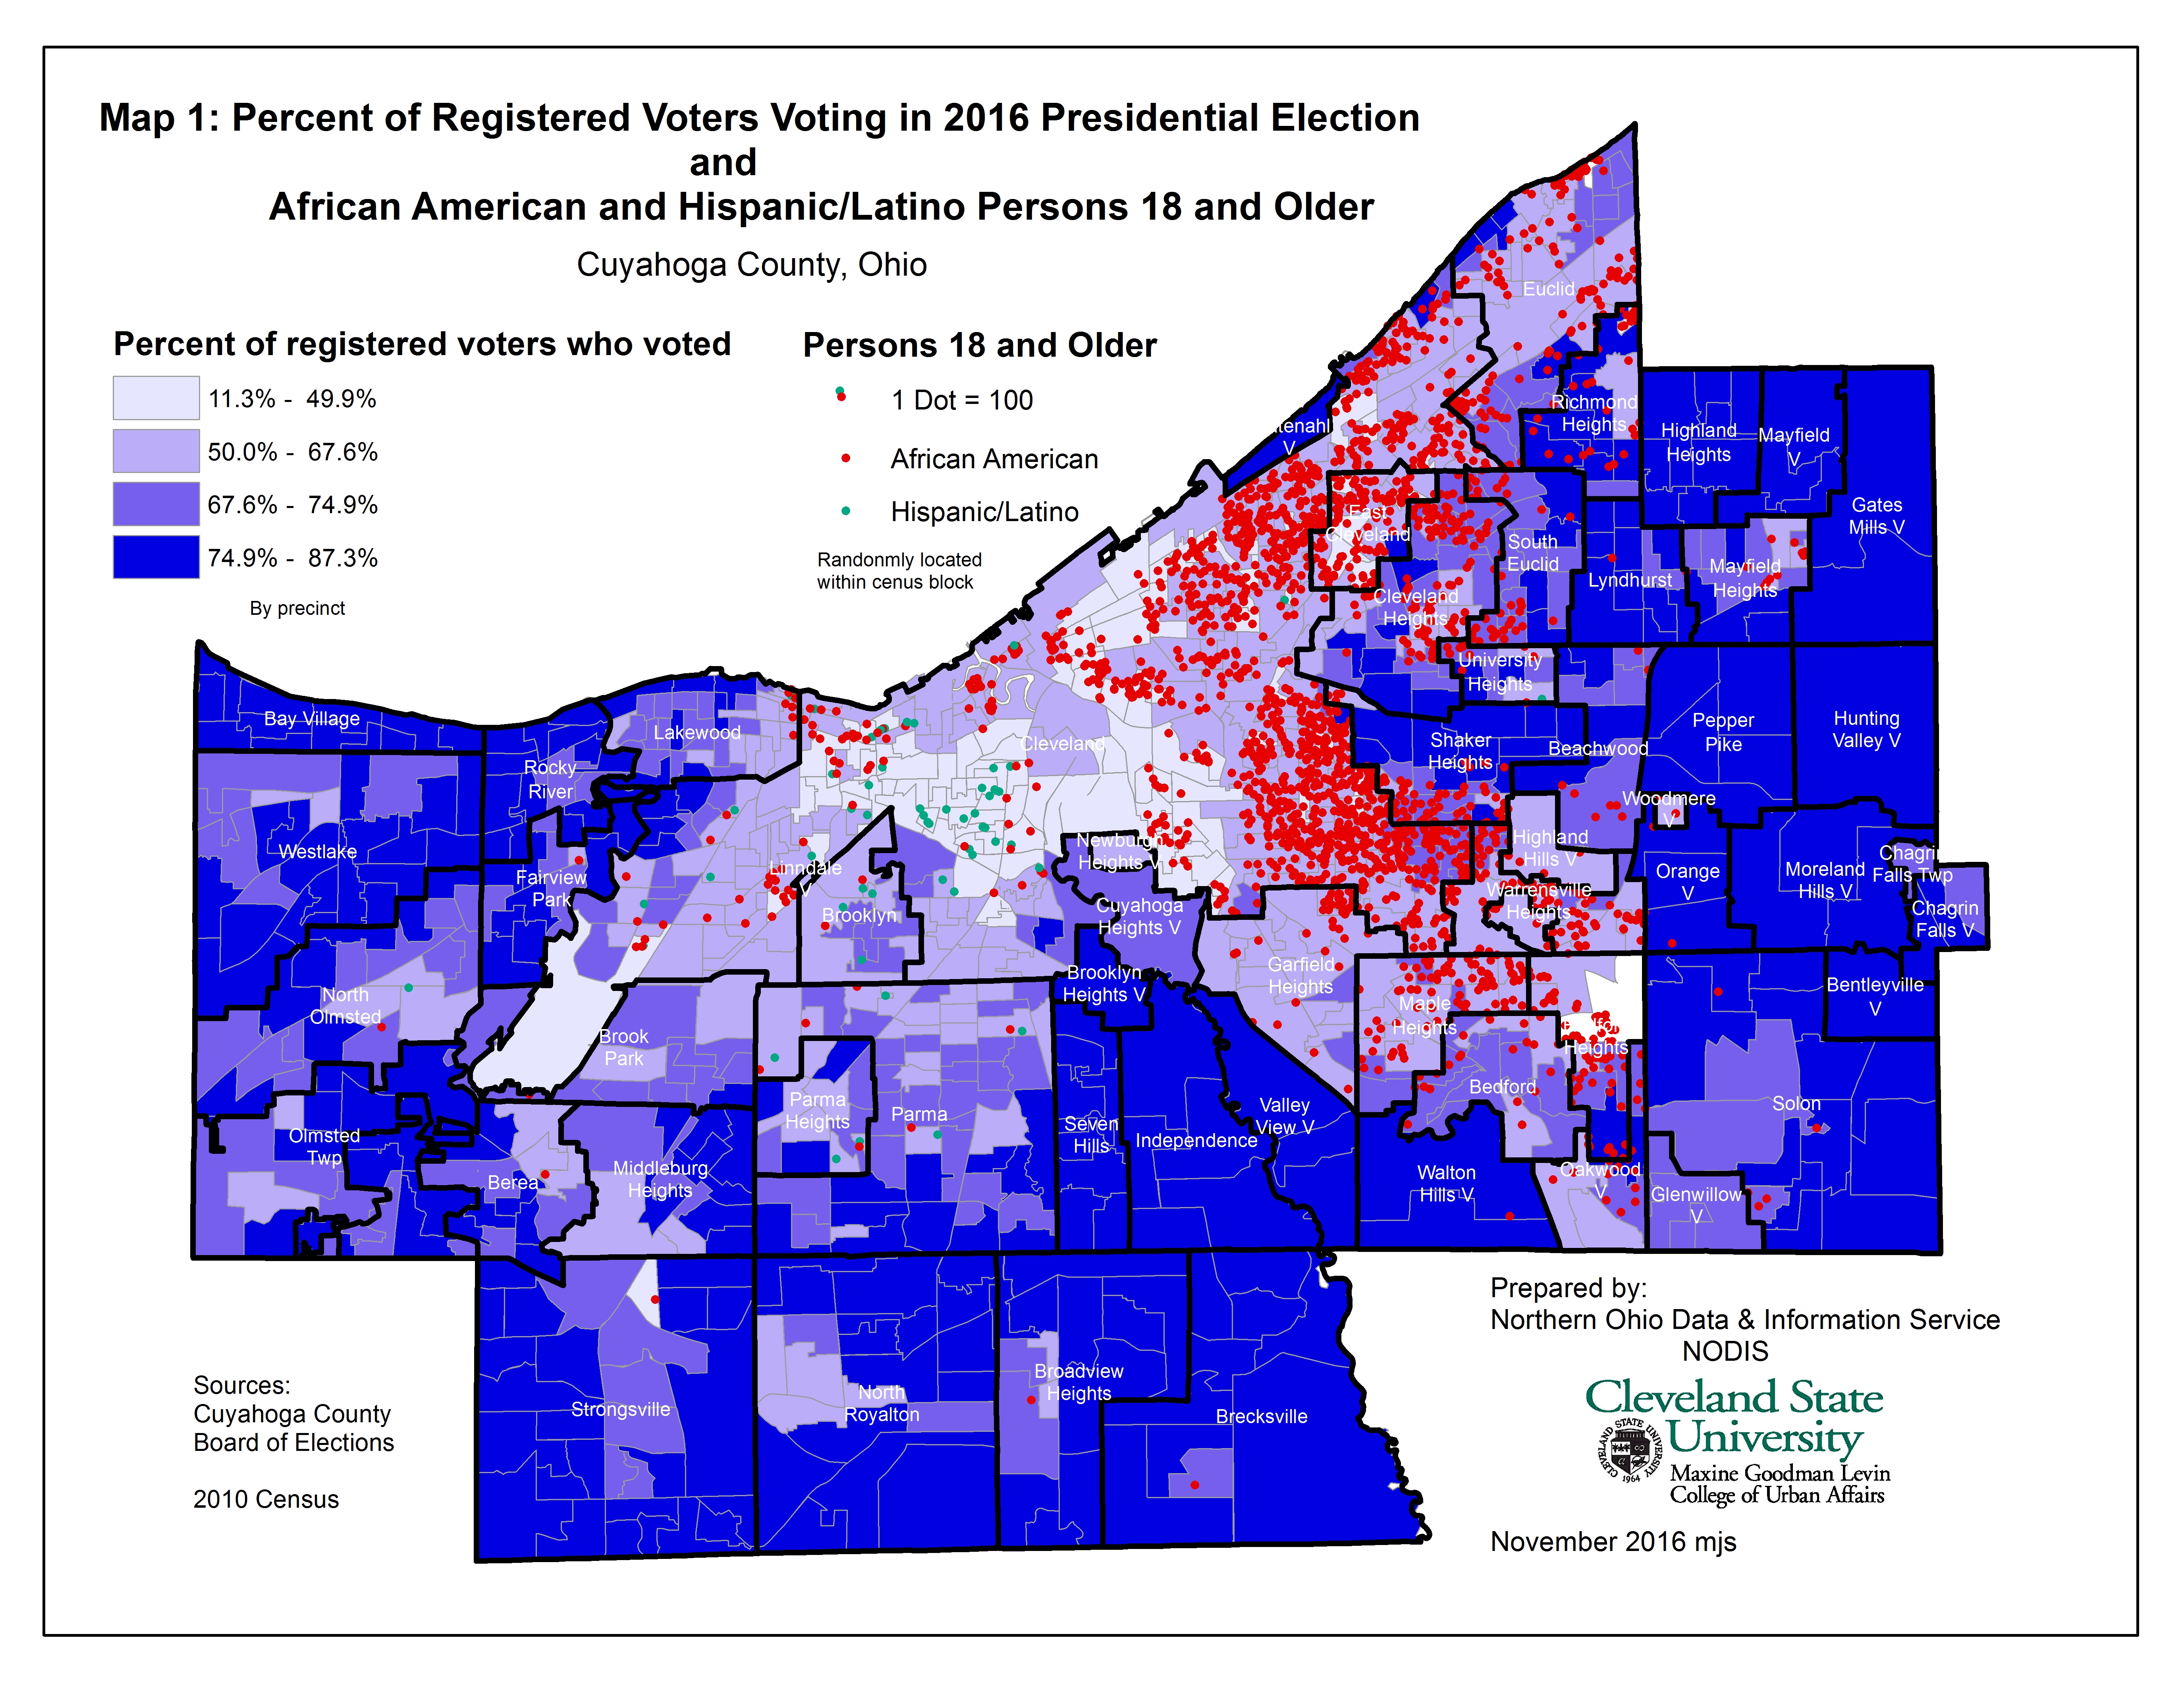 |
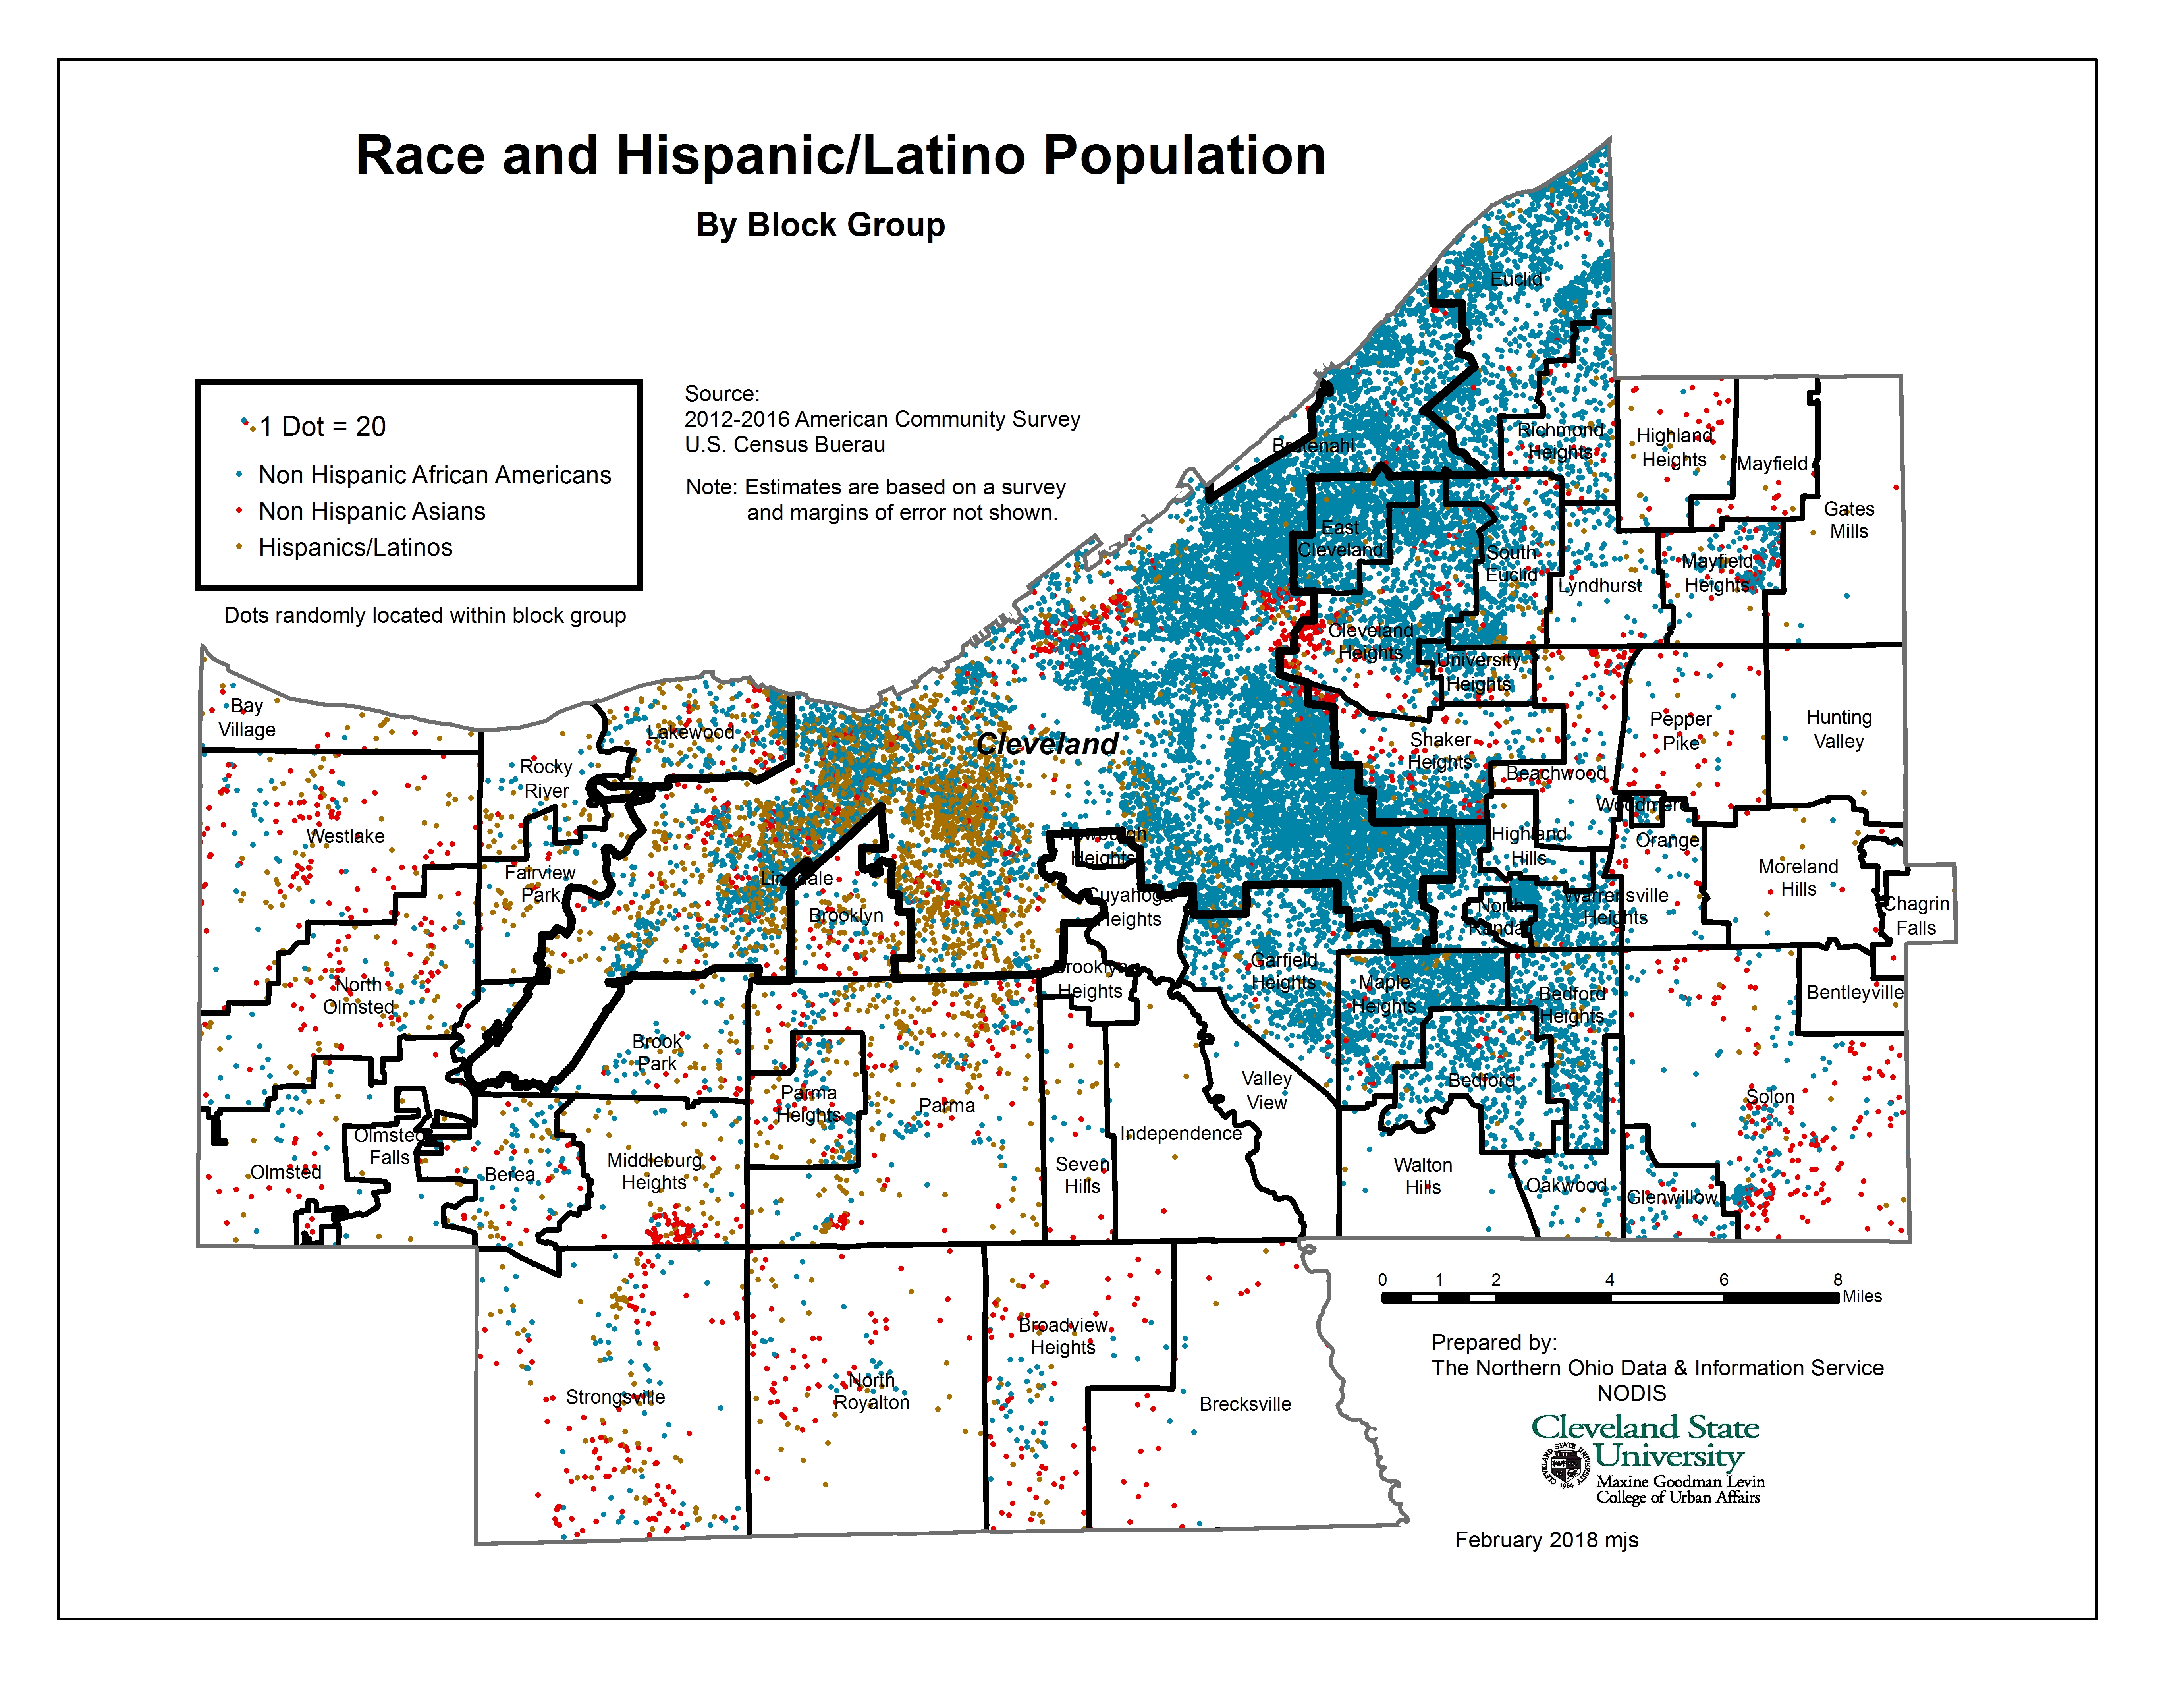
Race and Hispanic/Latino Population |
 |
| Non-Hispanic Whites with Less than a Bachelor's Degree As a Percent of Persons 25 and Older and Votes for Trump/Pence in 2016 Presidential Election | 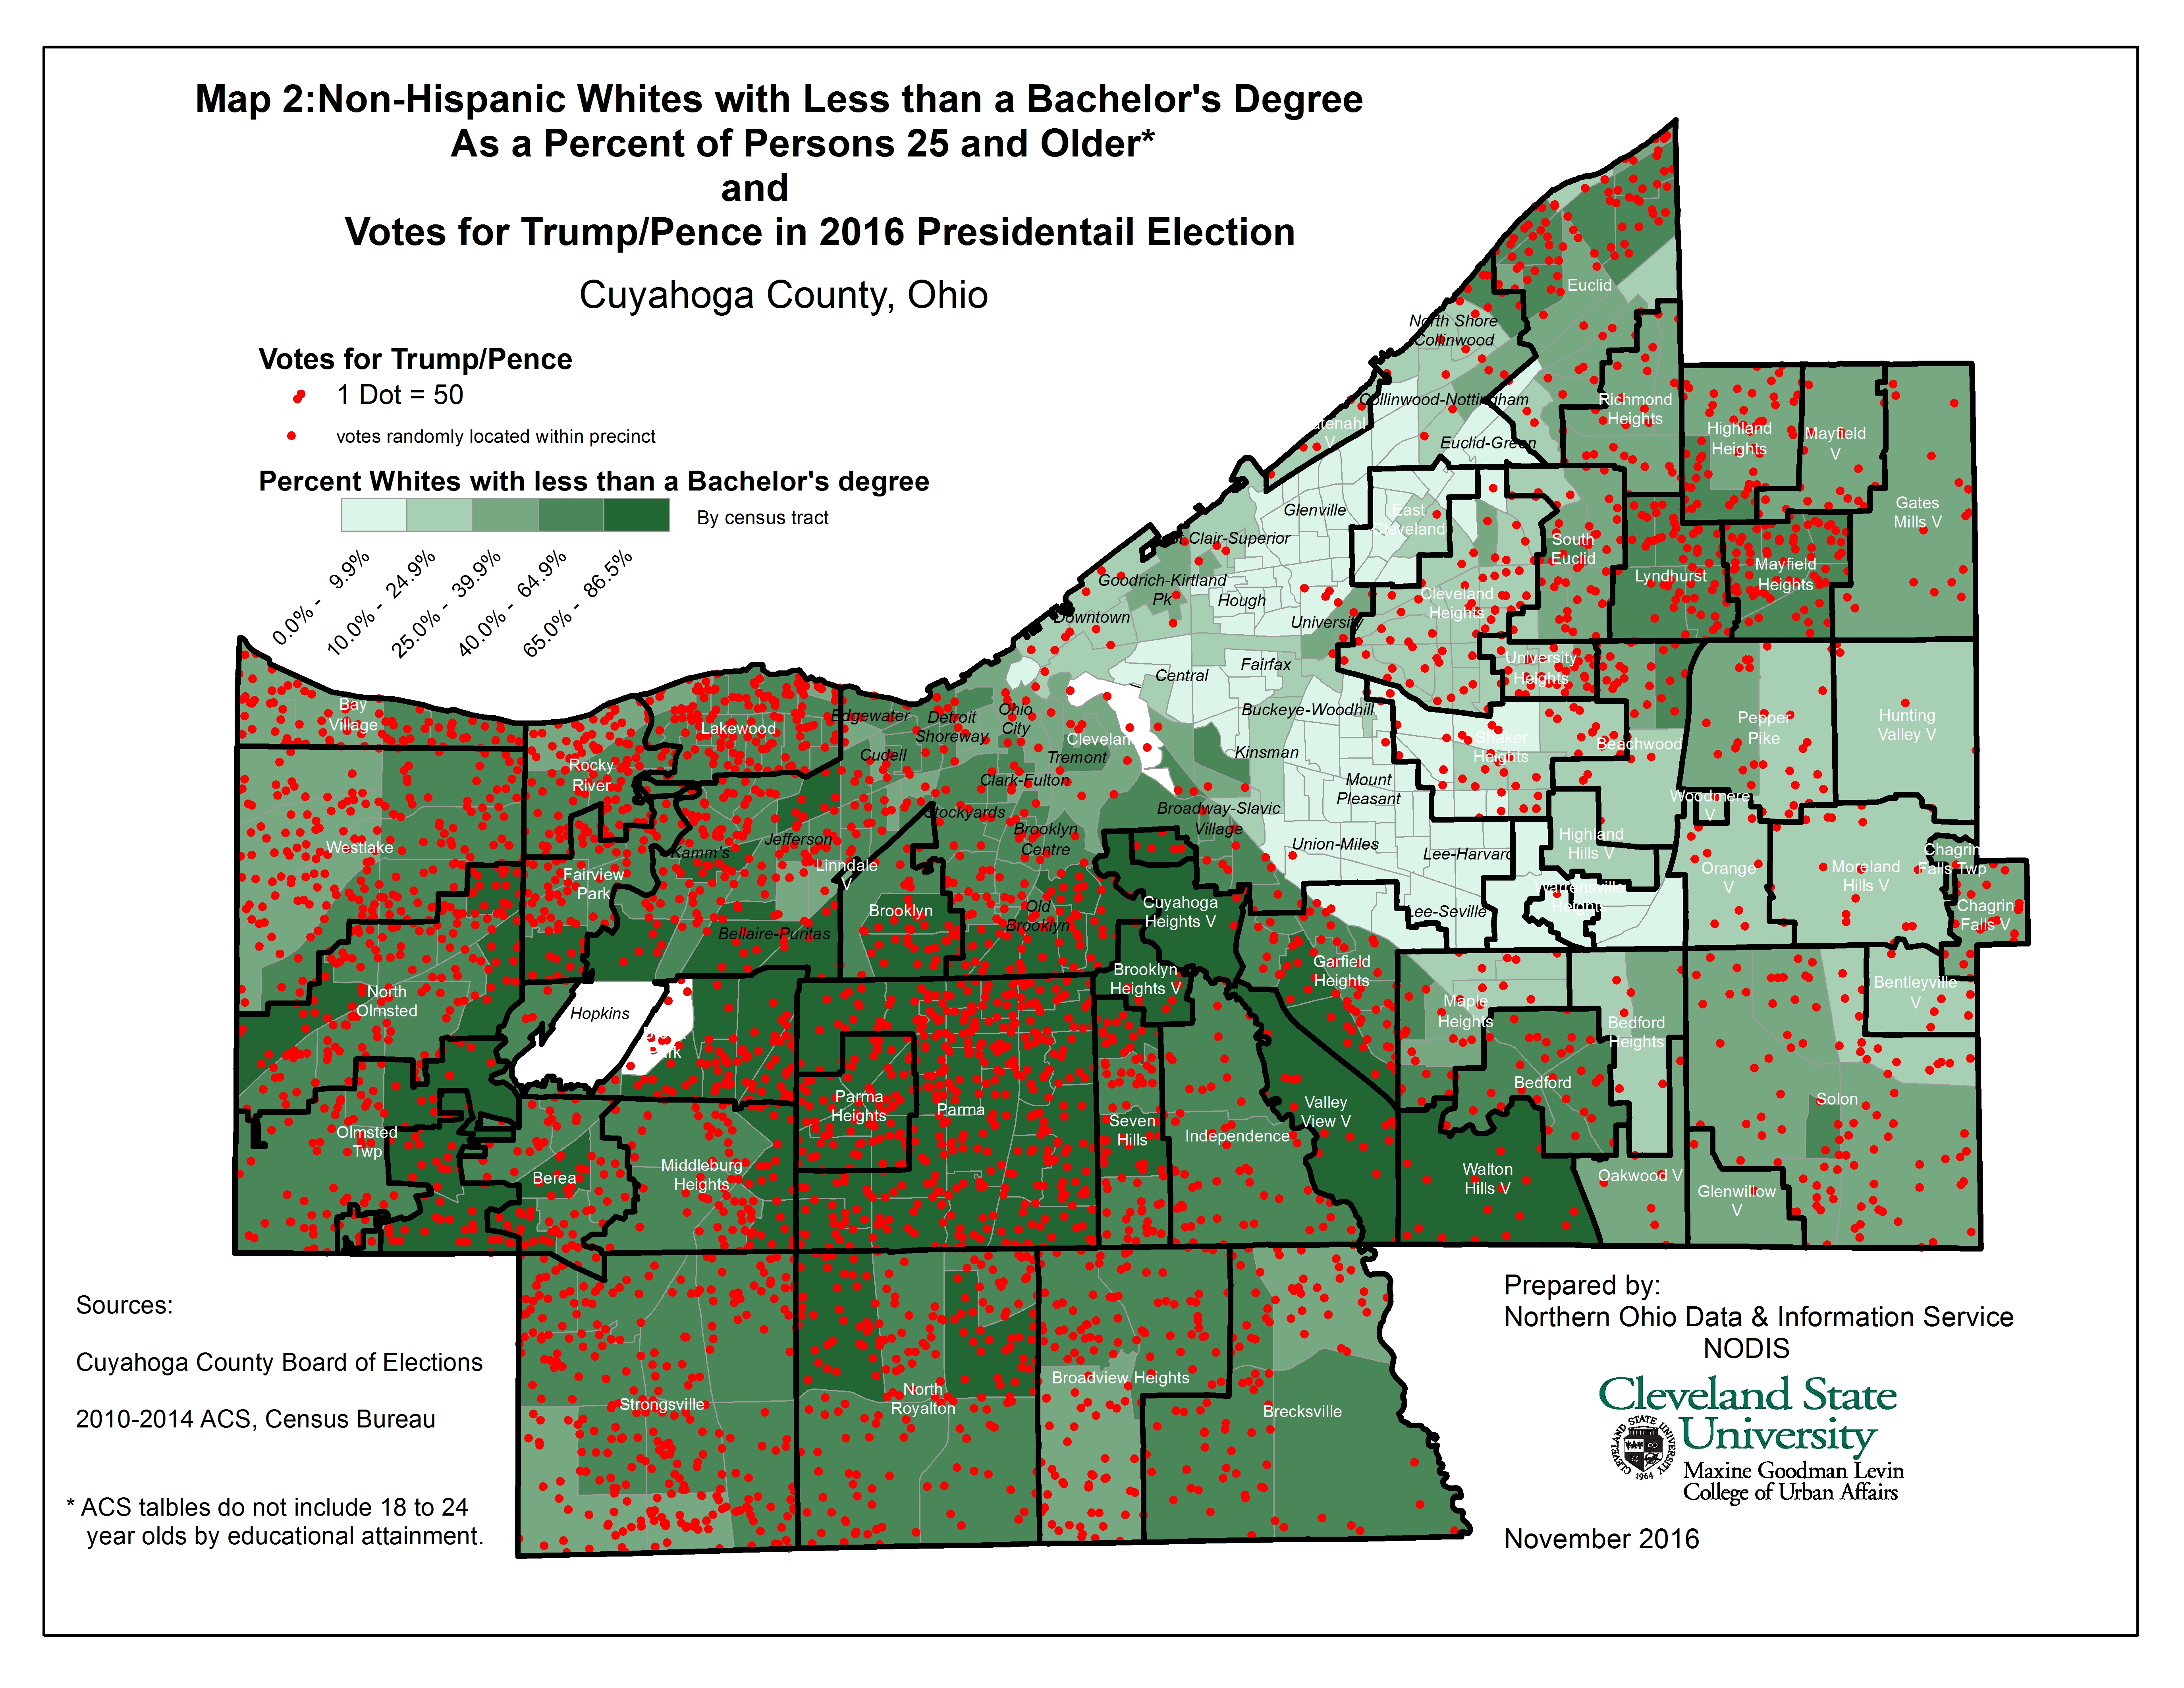 |
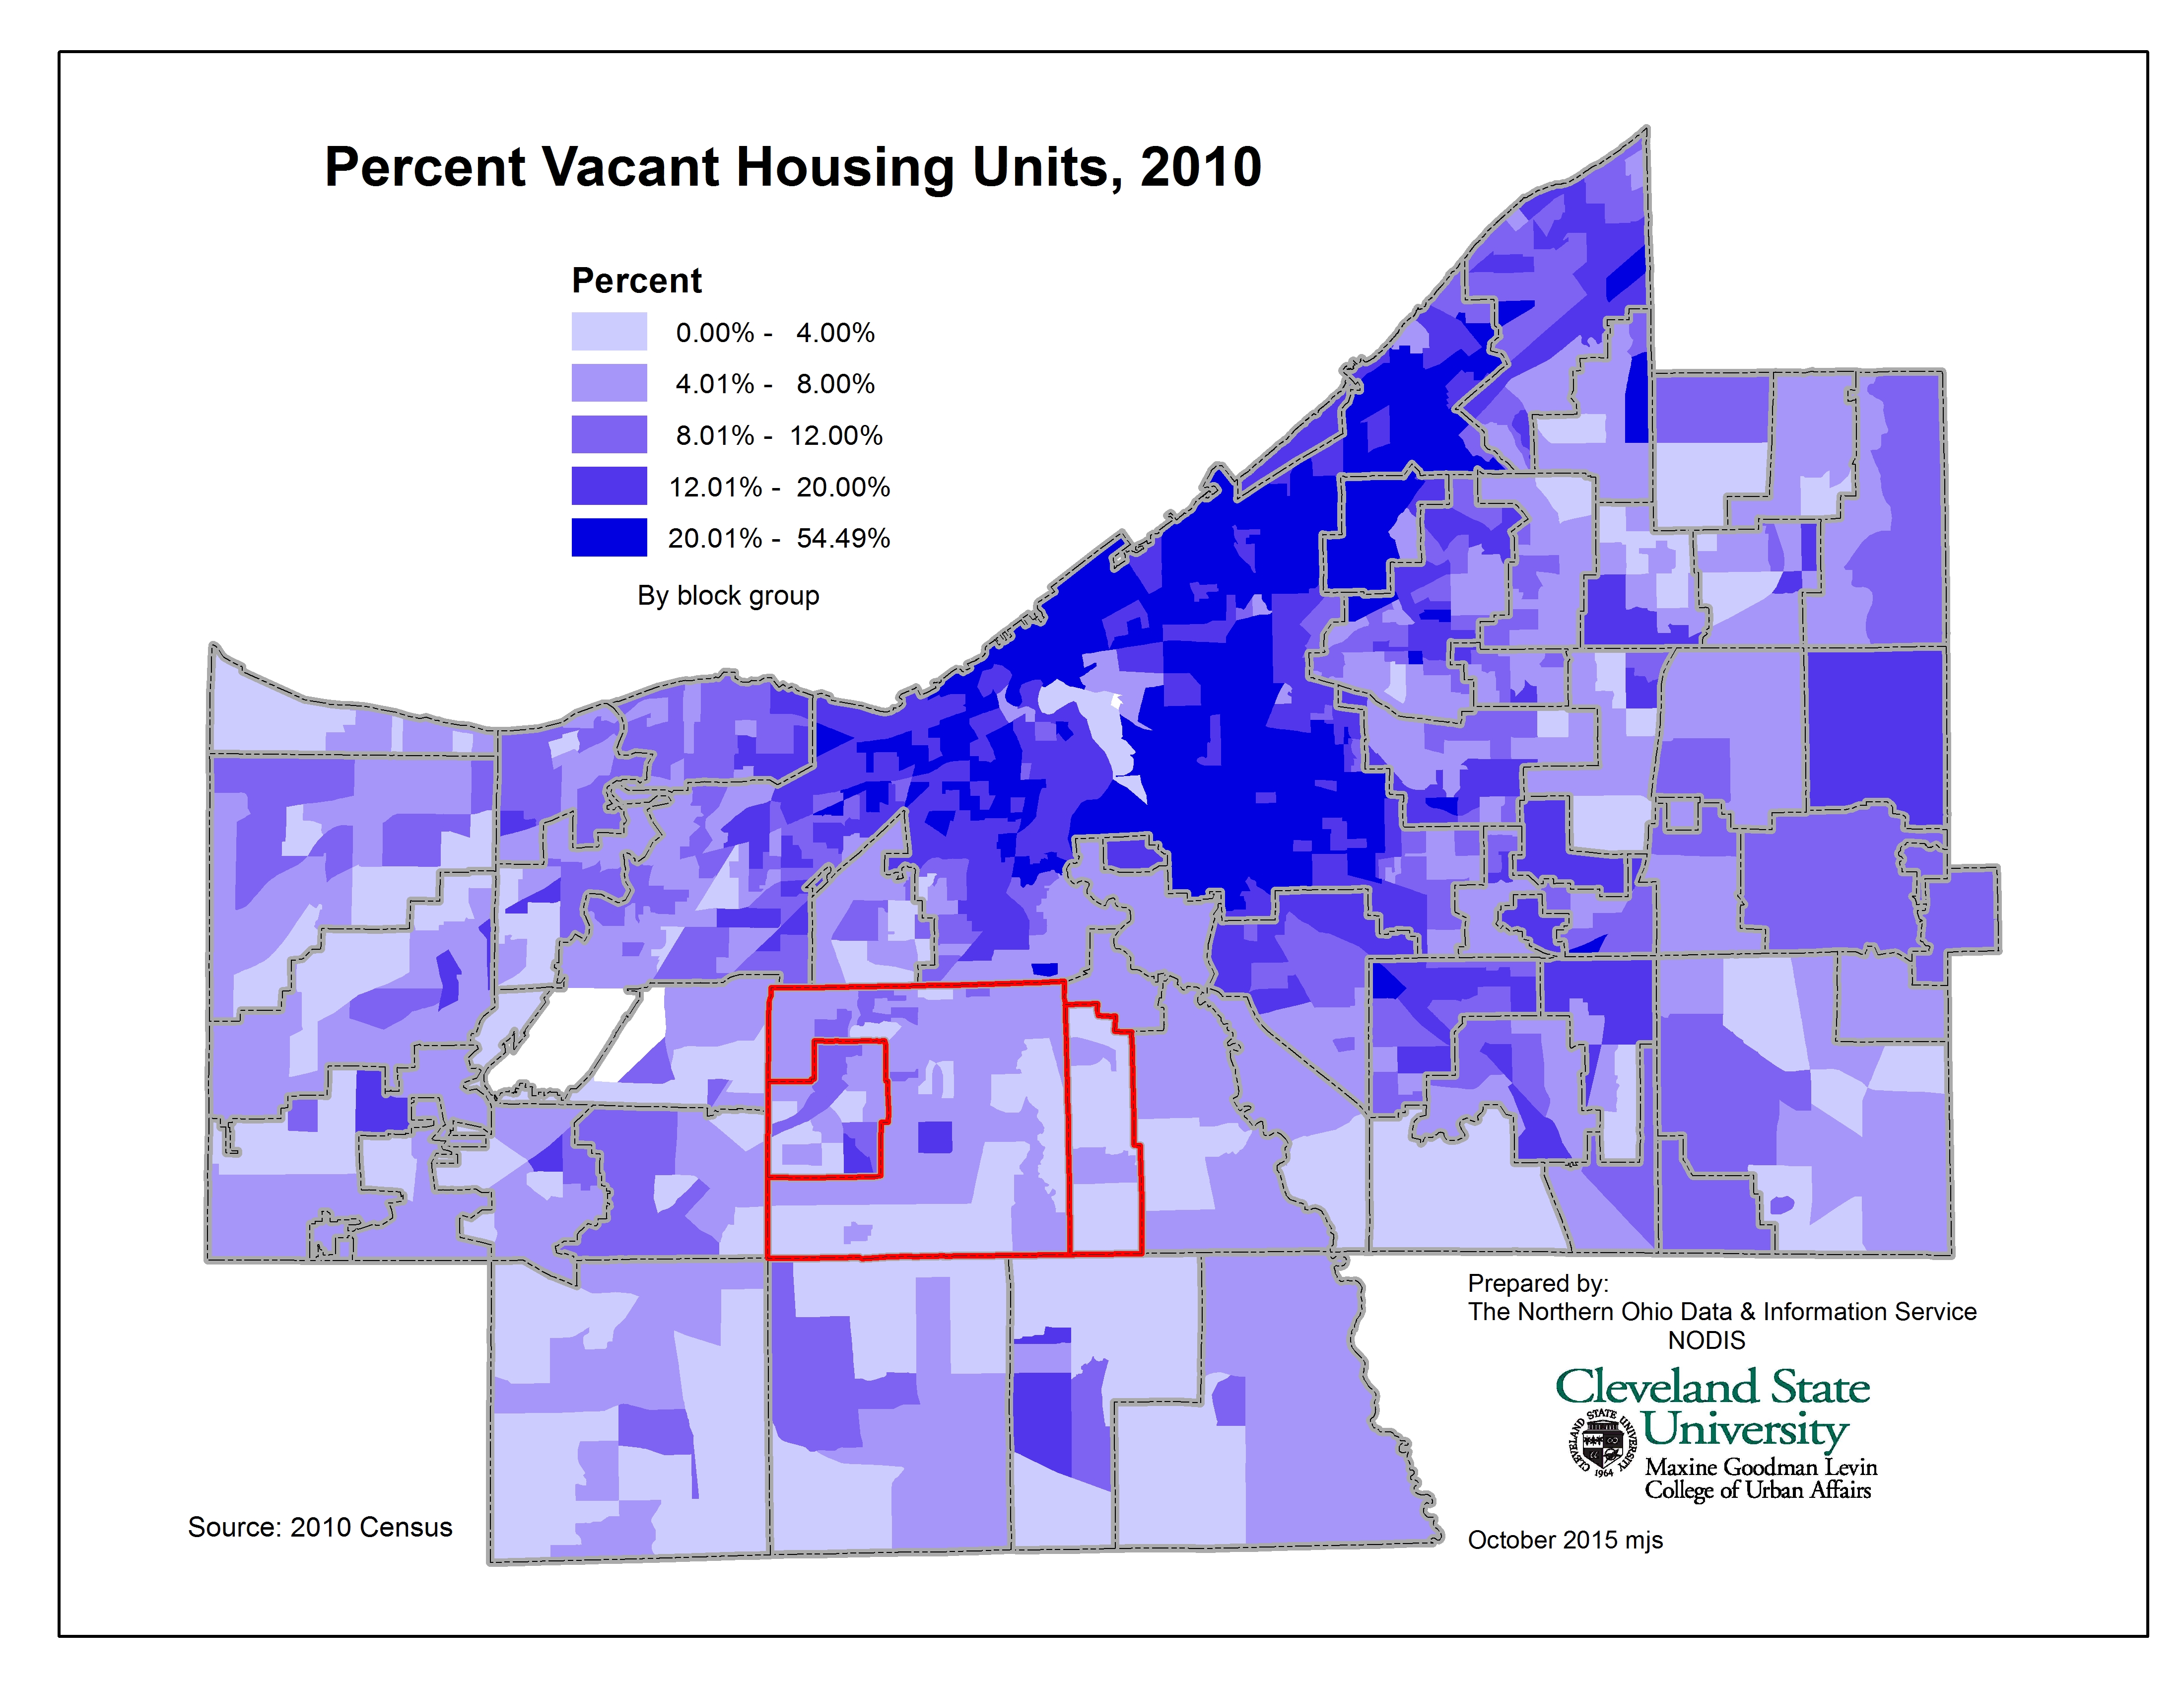
Percent Vacant Housing Units, 2010 |
 |
| Percent Asian Indian Population, 2000 | 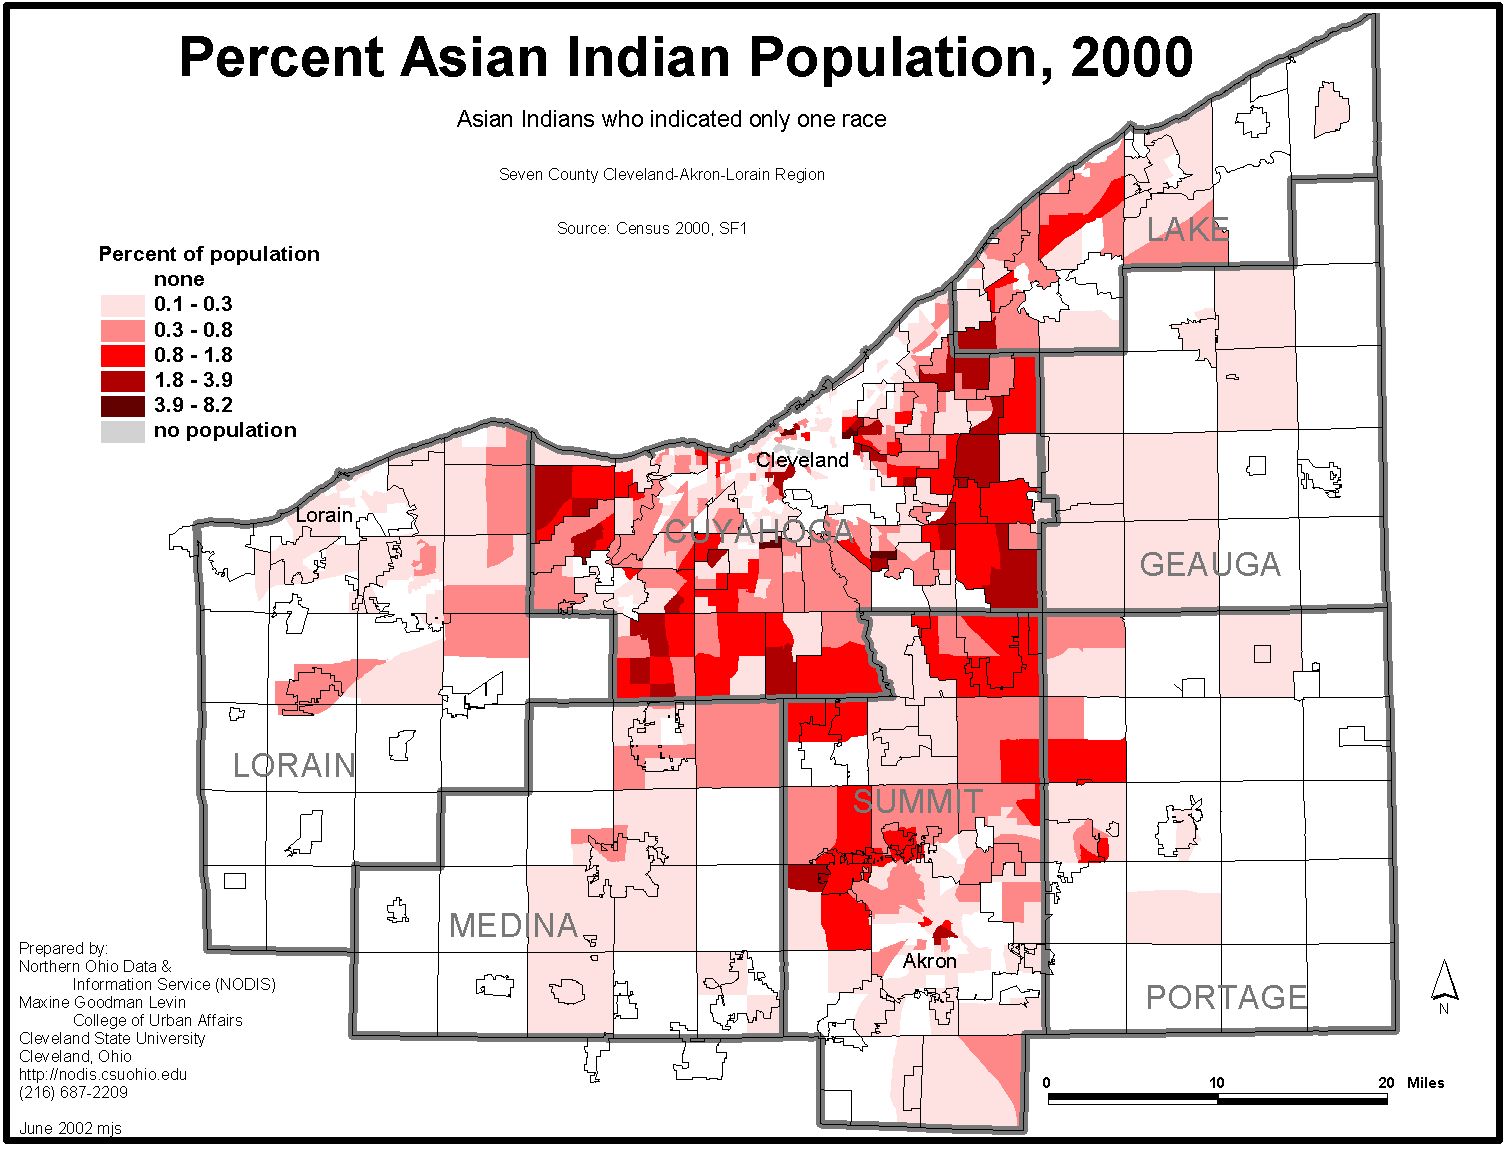 |
Percent Black, 2000 | 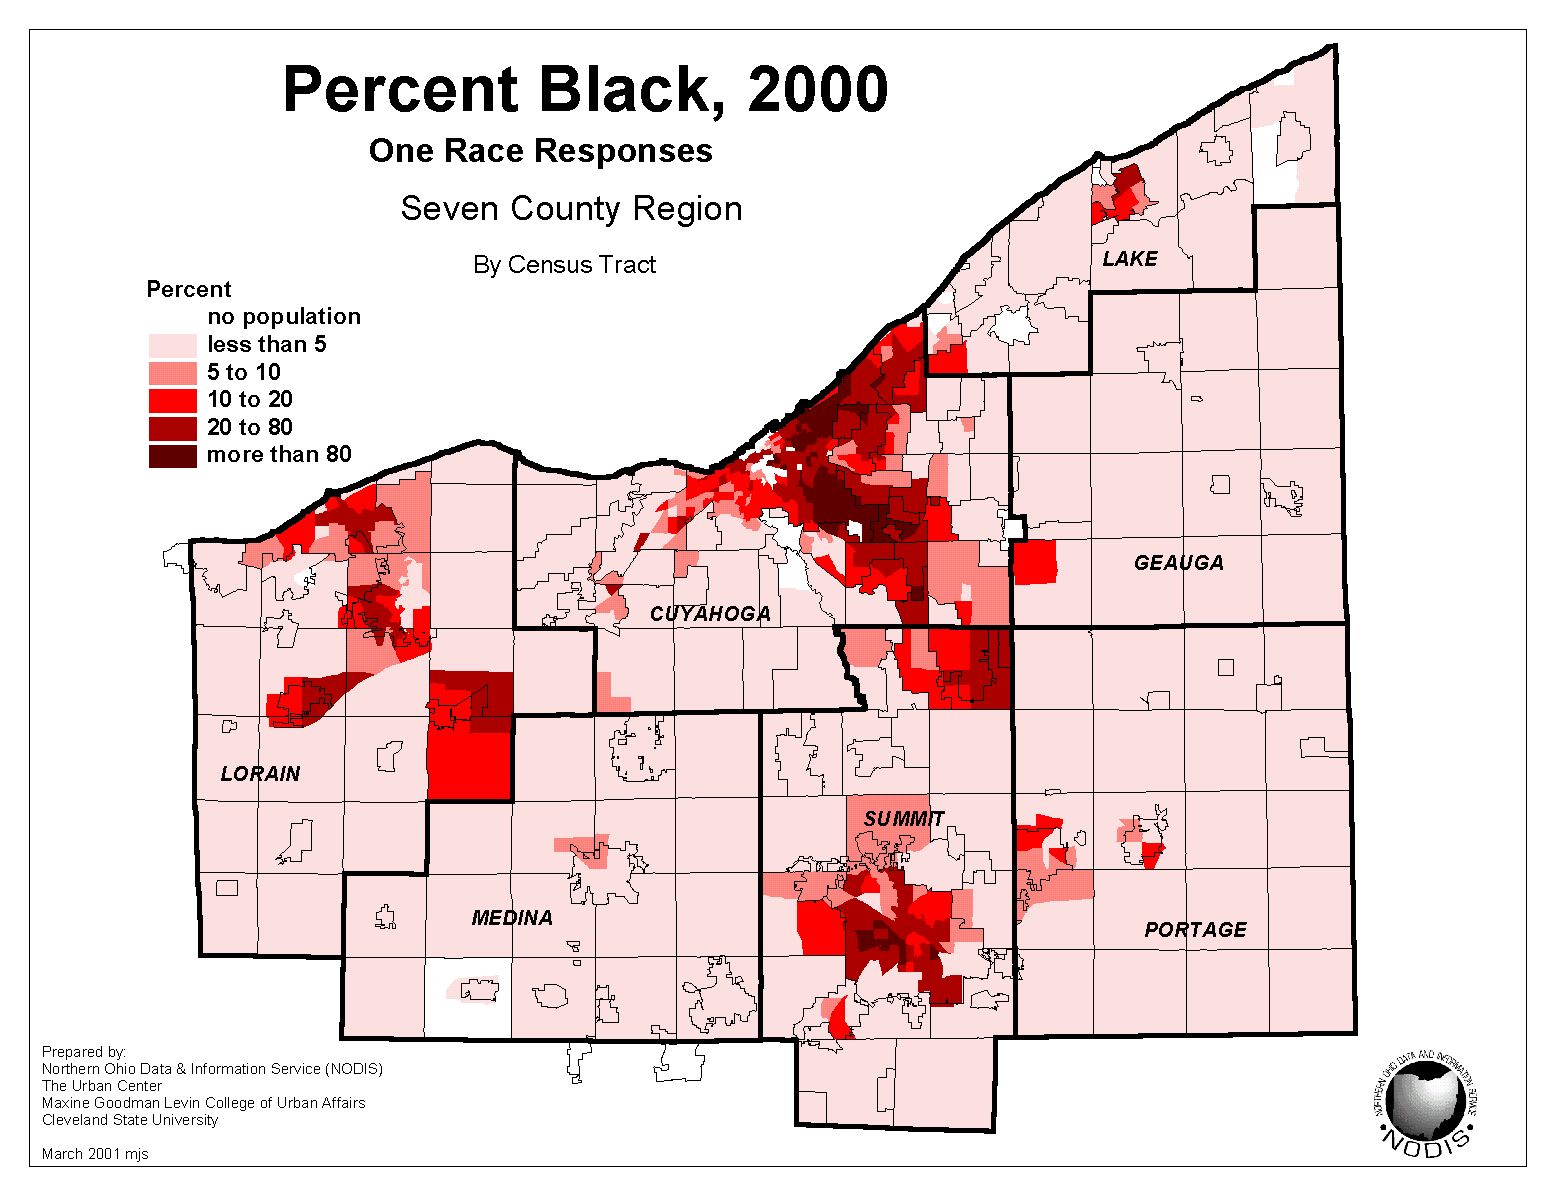 |
| Percent with a Bachelor's Degree, 2000 (for persons 25 and over) | 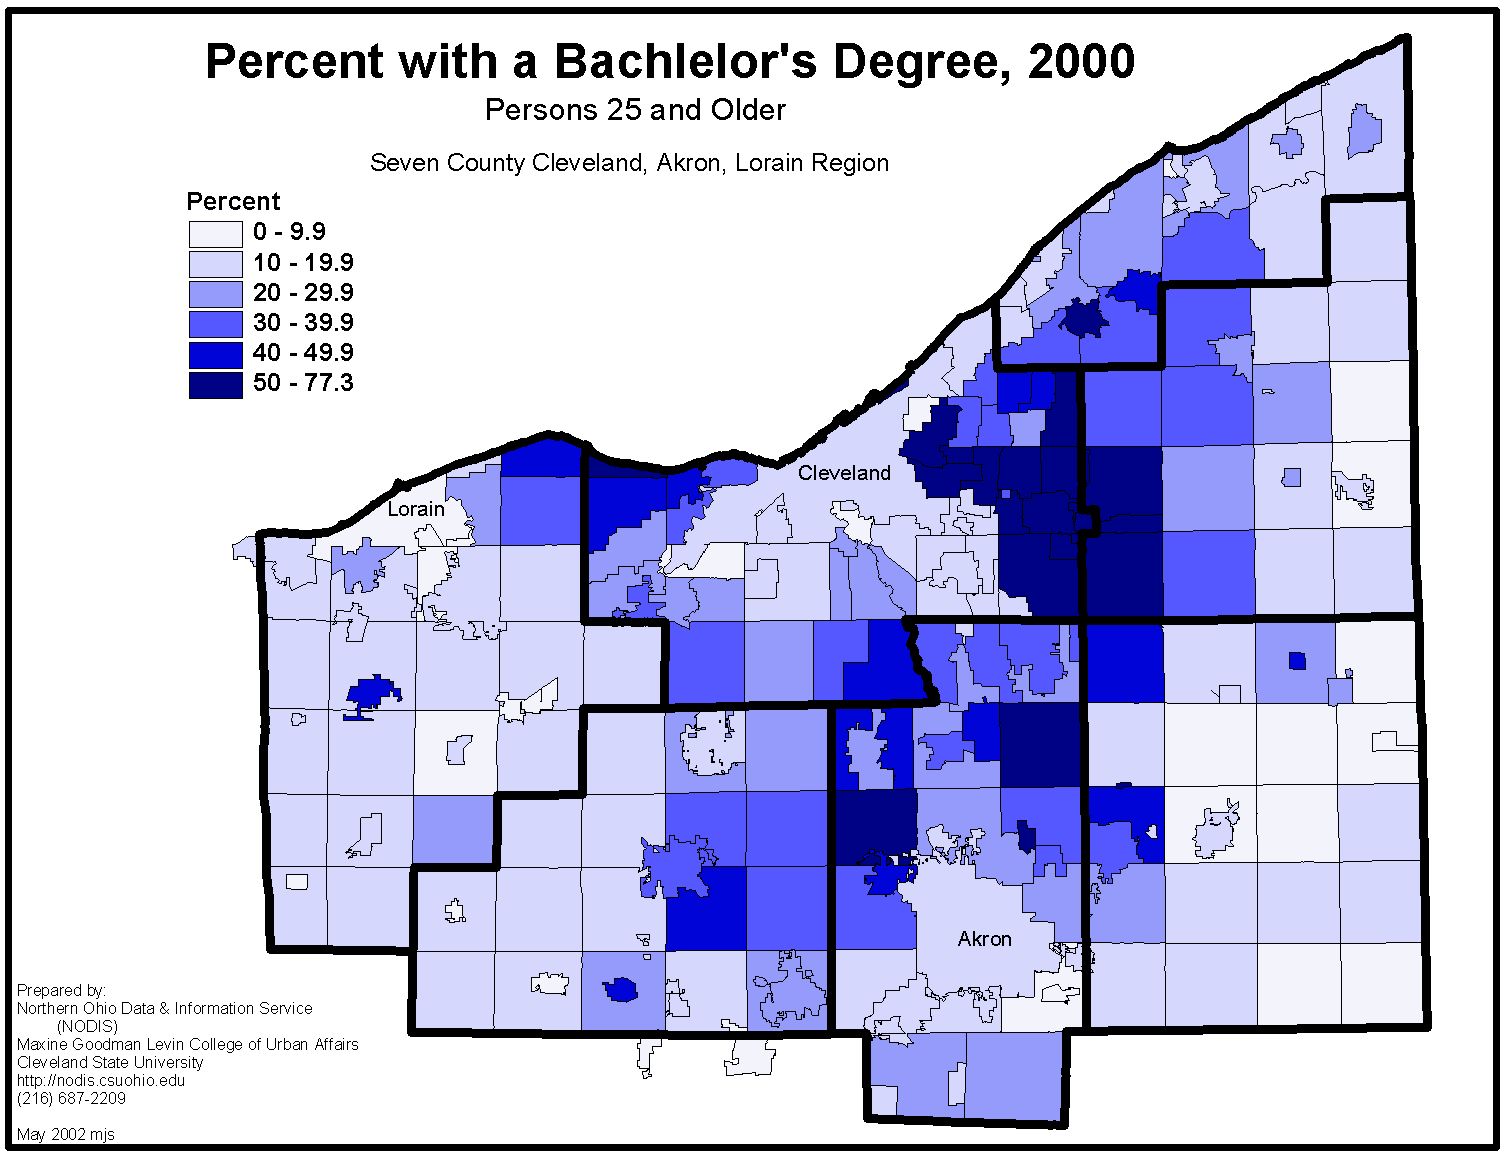 |
Percent Black 2000 | 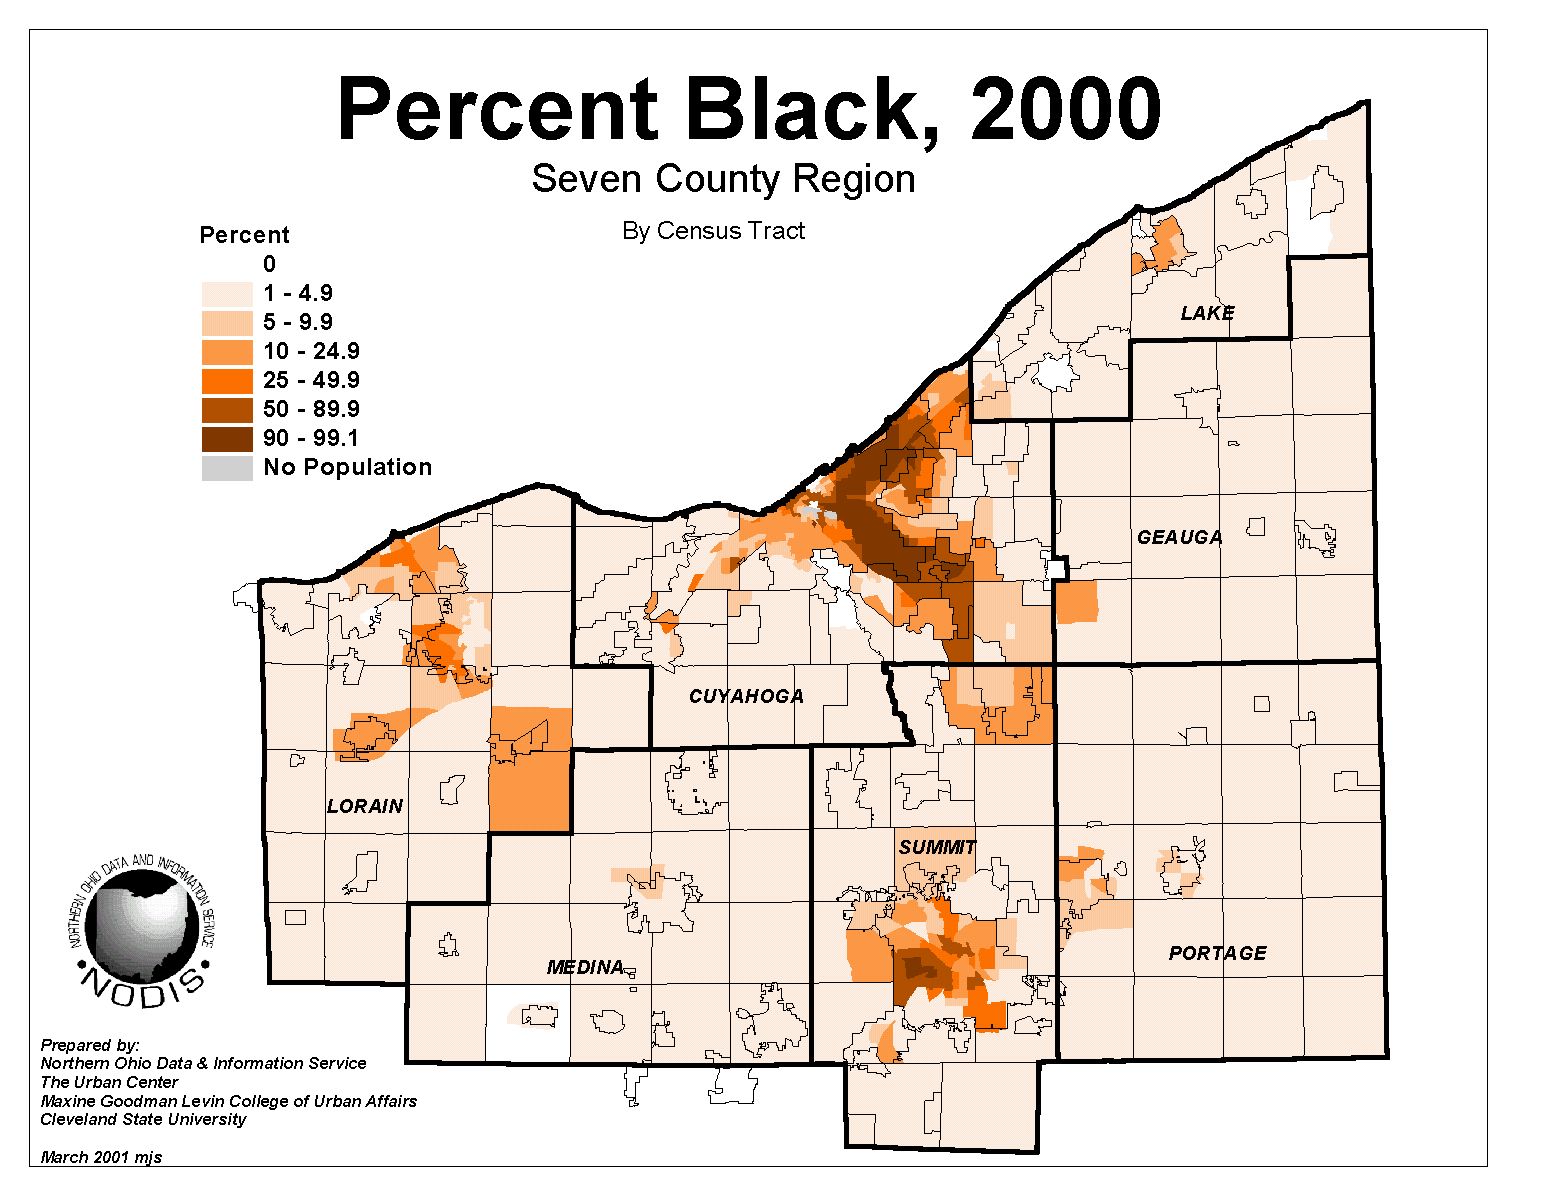 |
| Change in Percent with a Bachelor's Degree, 1990 to 2000 | 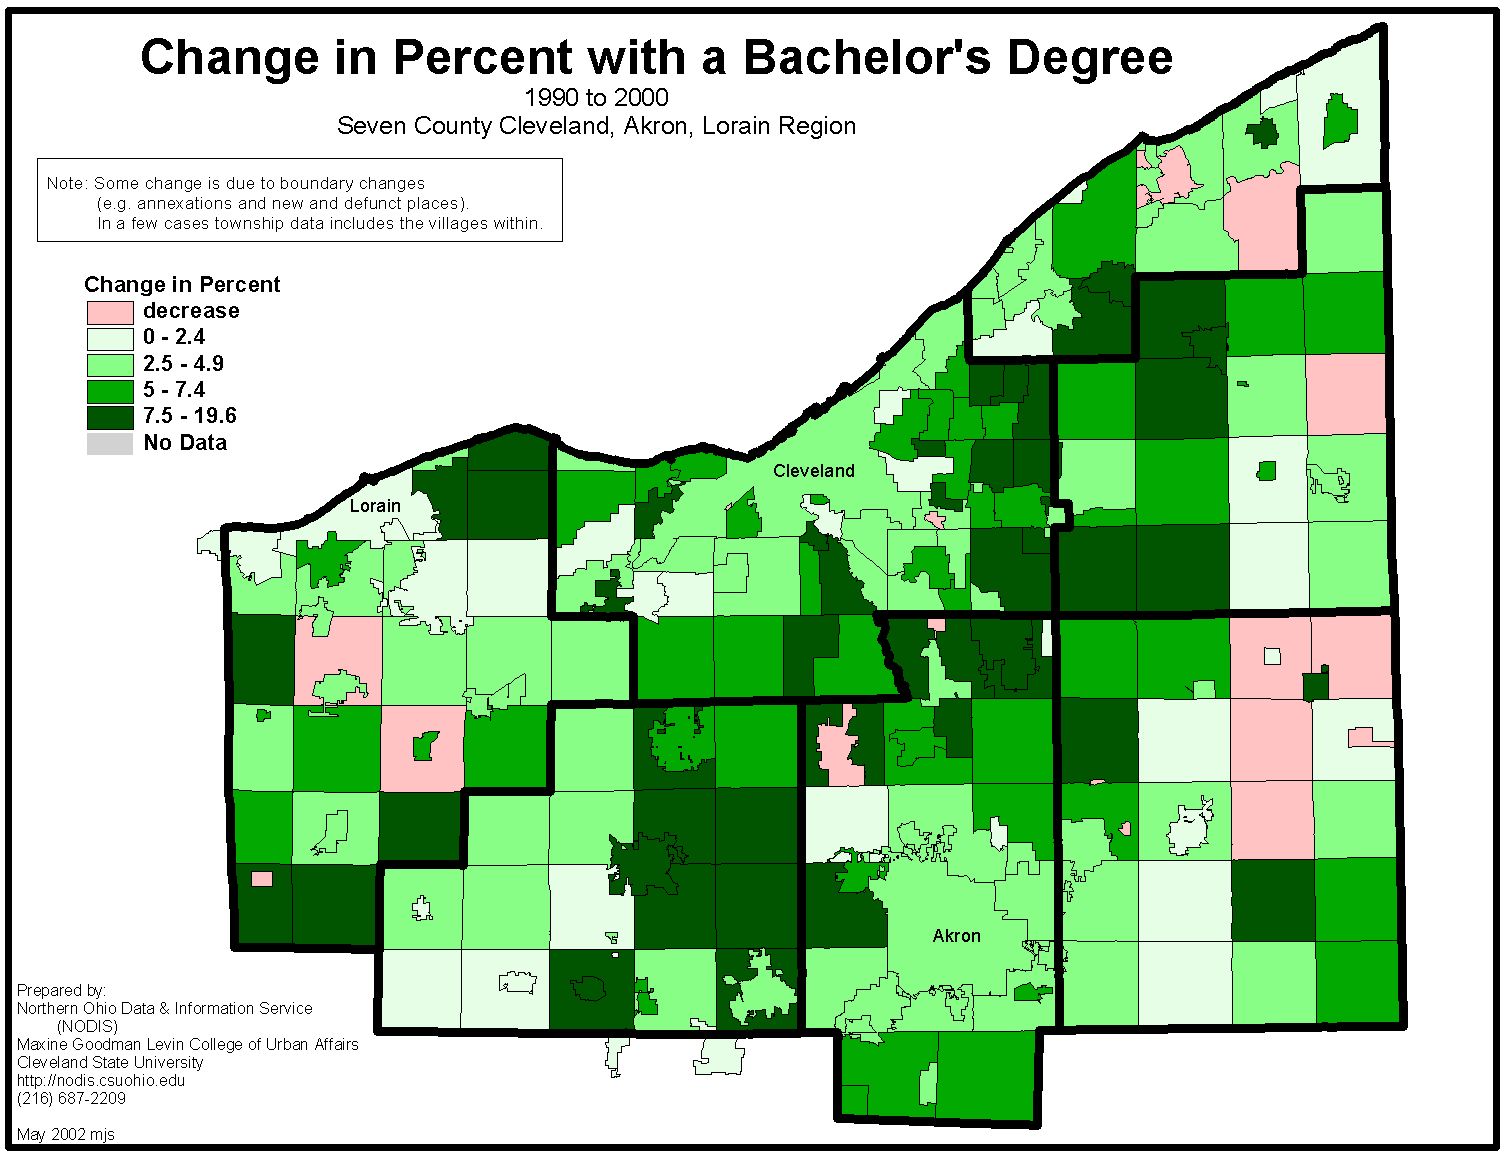 |
Percent Change in Number of Families Below Poverty, 1990 to 2000 | 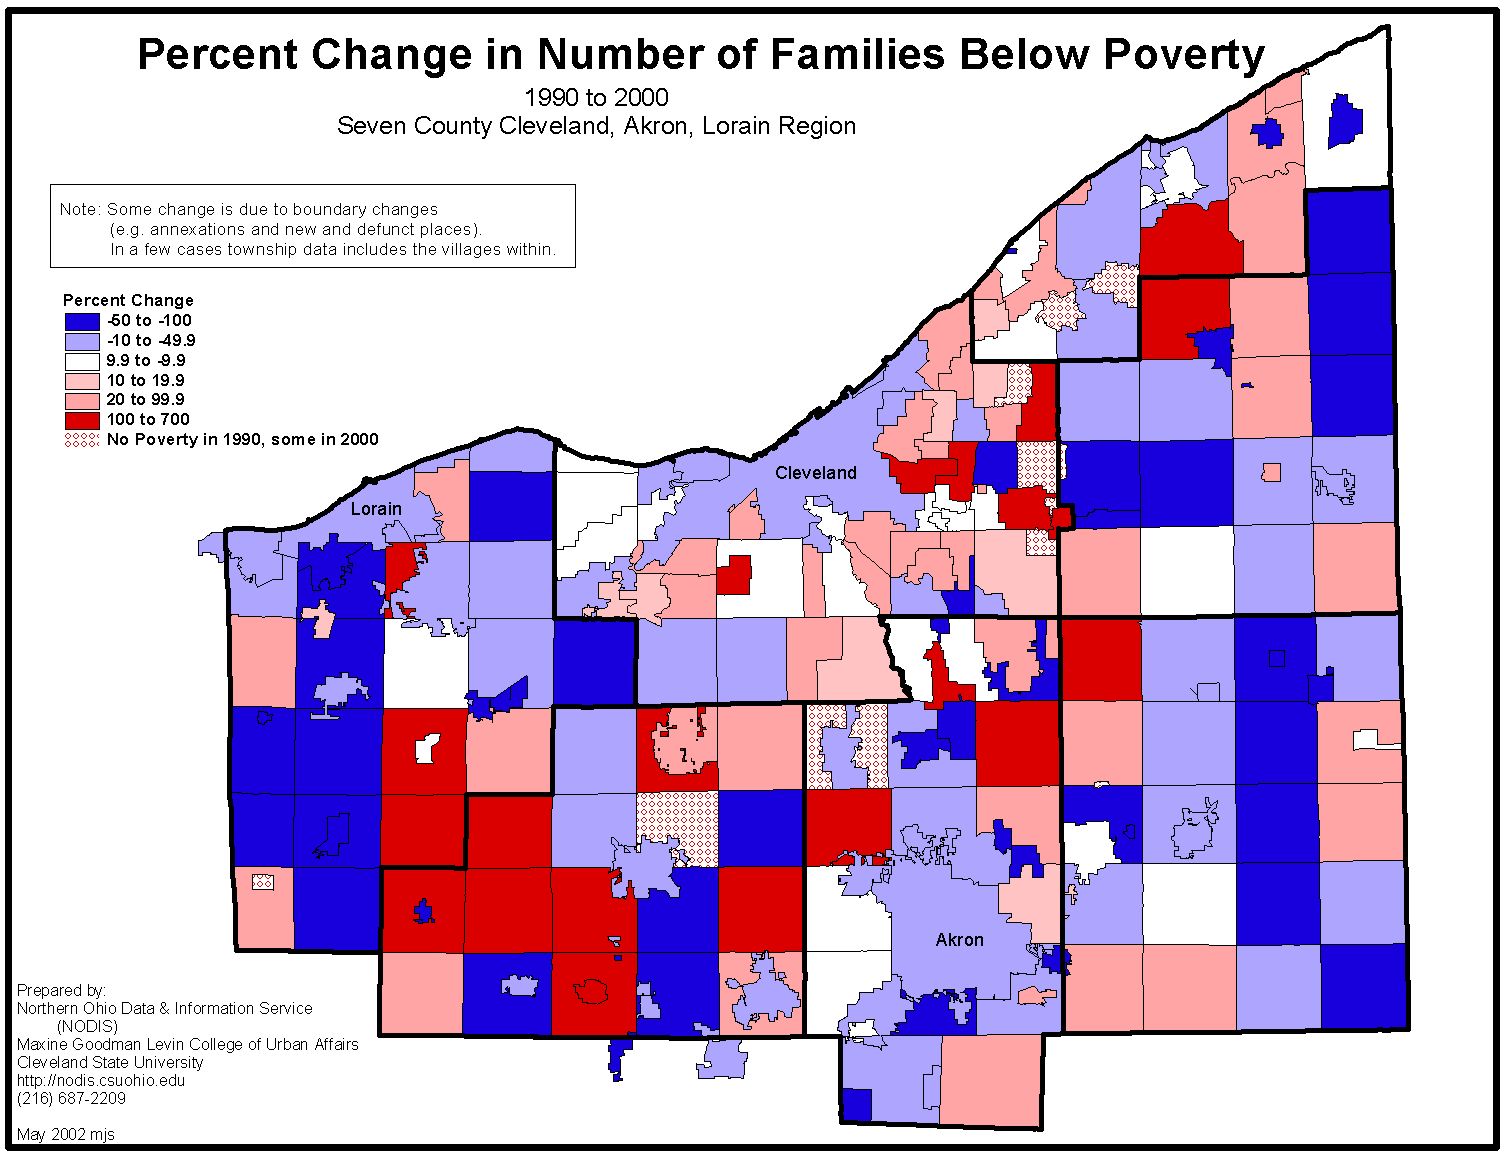 |
| Median Household Income, 1999 | 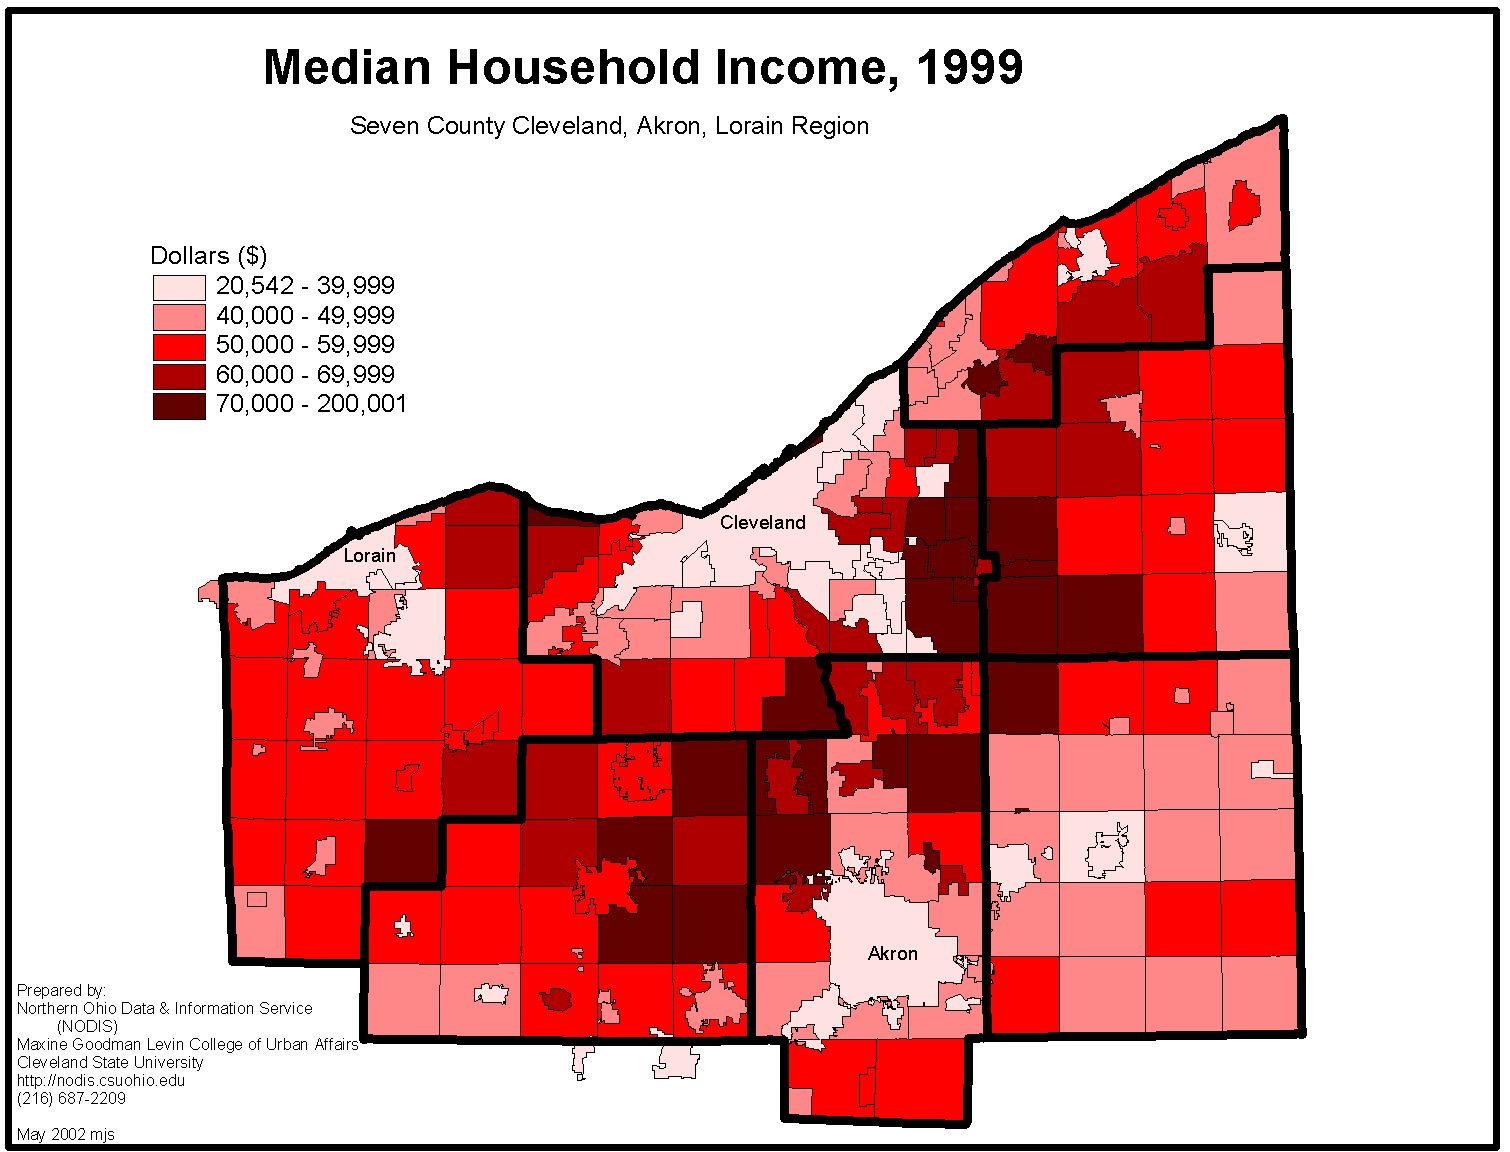 |
Change in Number of Families Below Poverty, 1990 to 2000 | 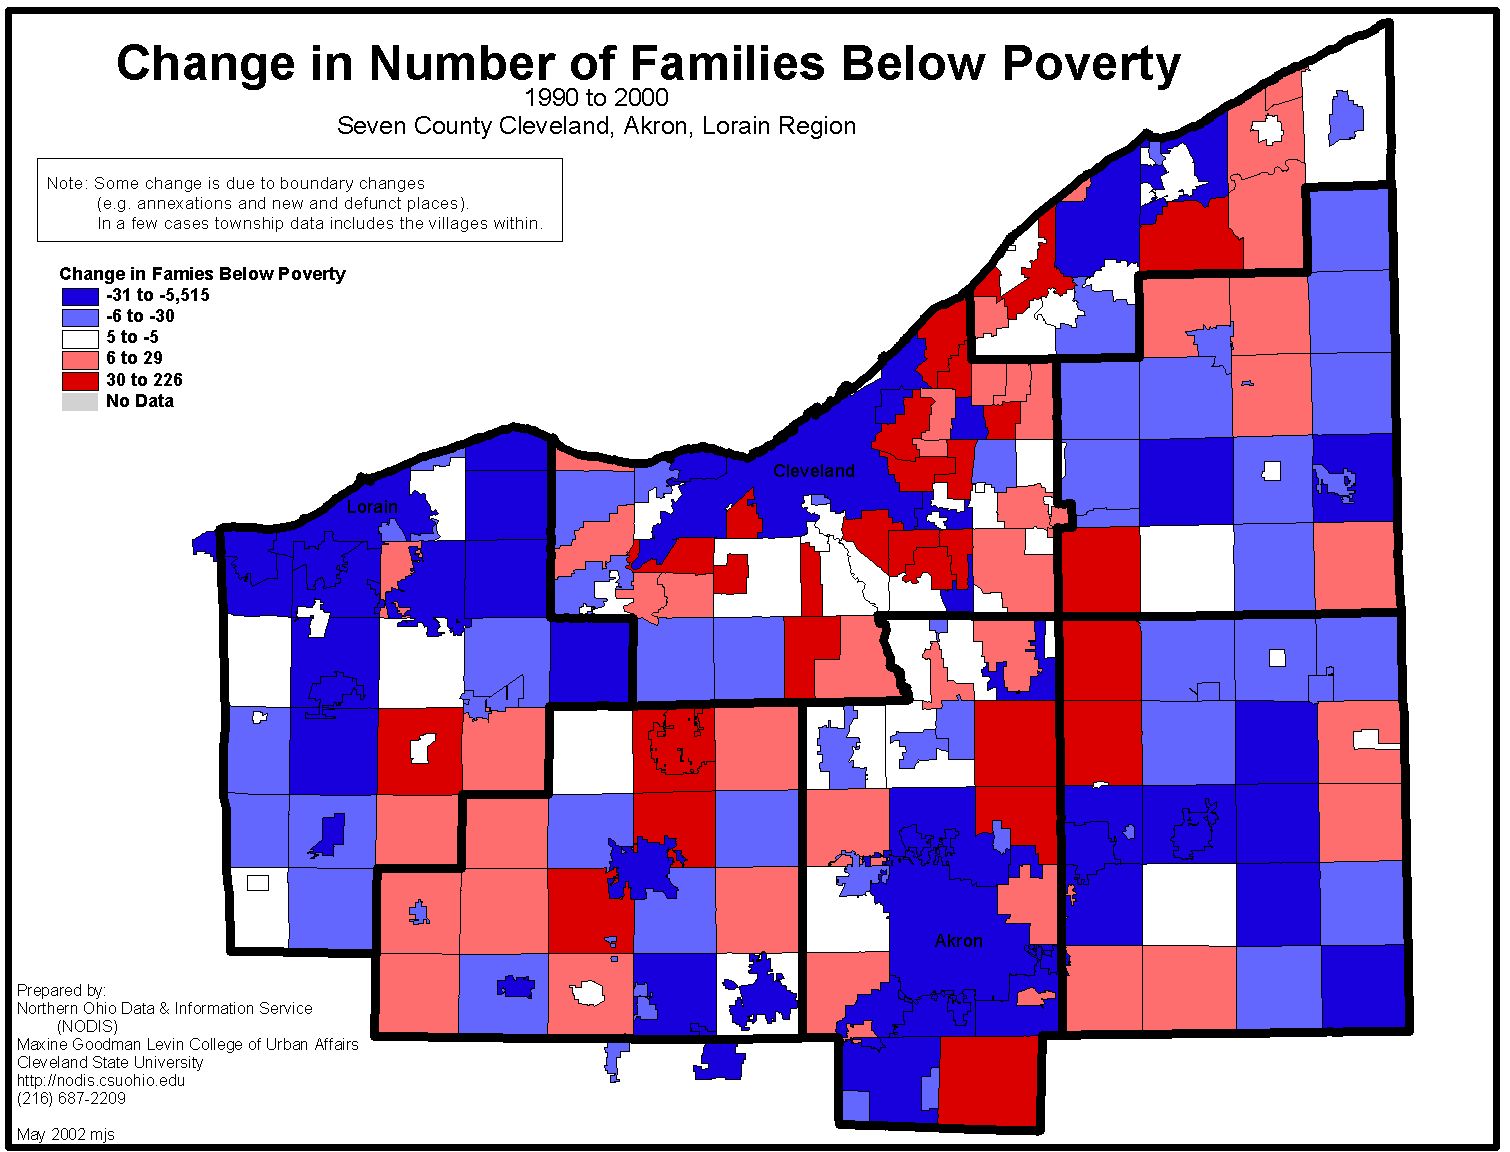 |
| Change in Median Household Income 1990 to 2000 | 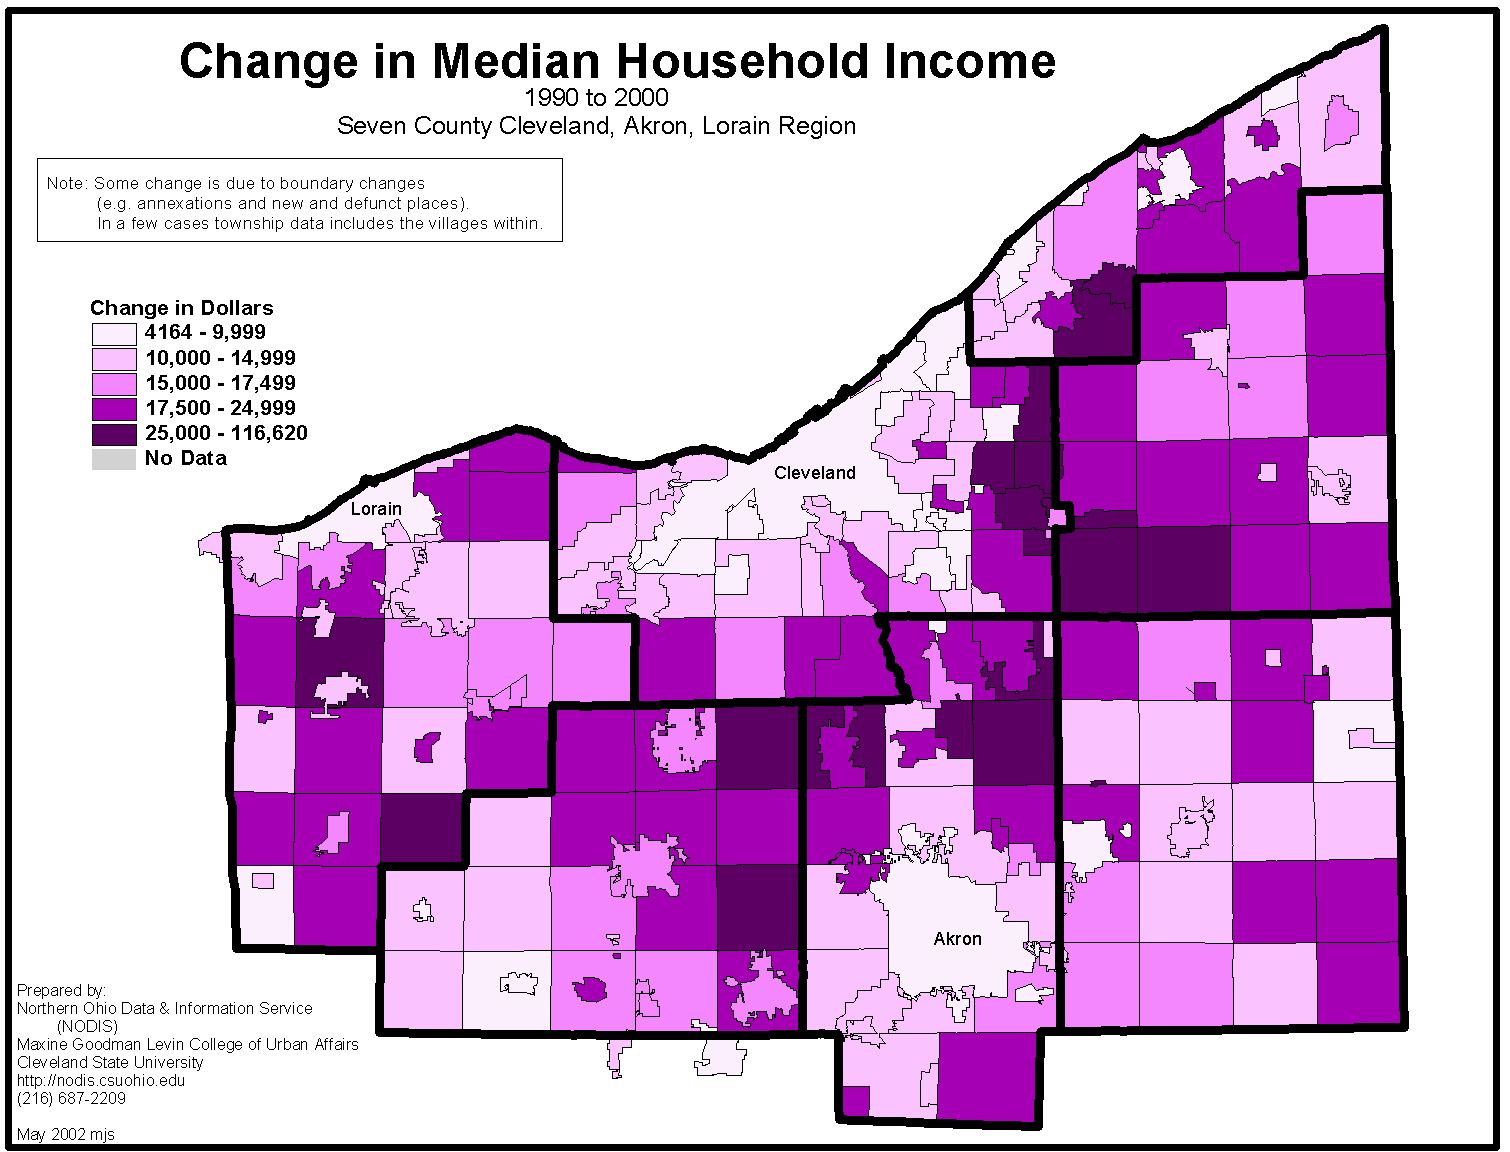 |
Change in Percent Families Below Poverty, 1990 to 2000 | 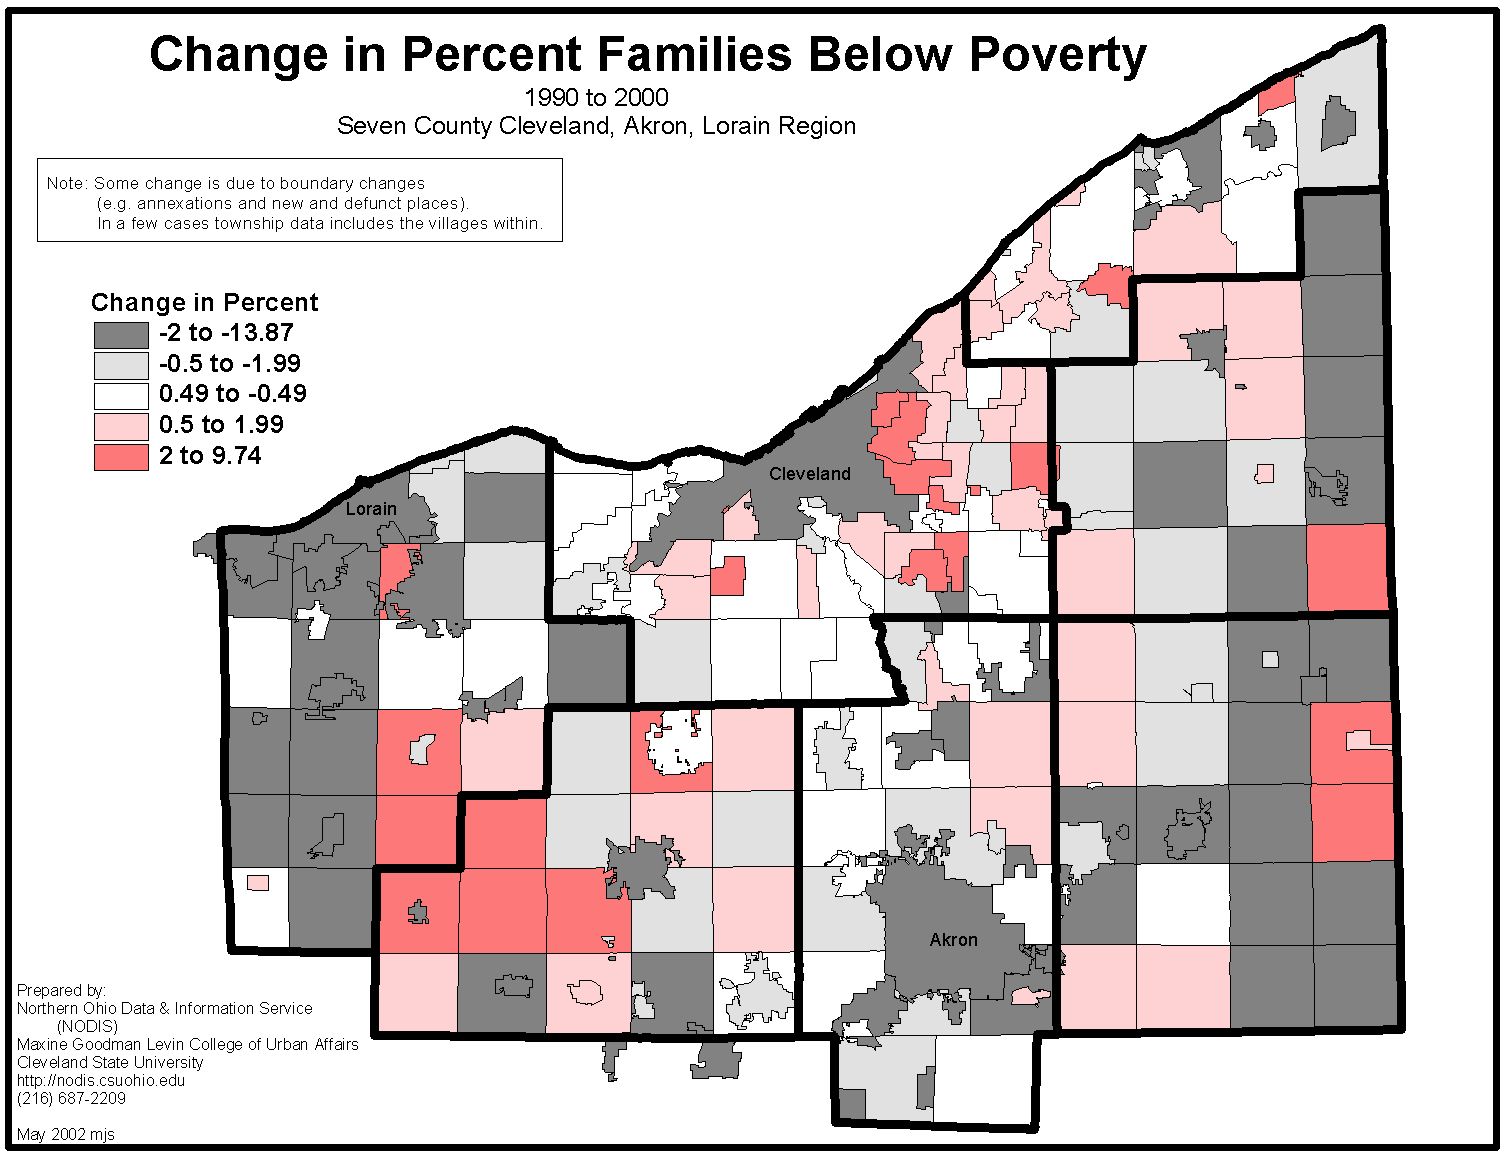 |
| Median Rent, 2000 | 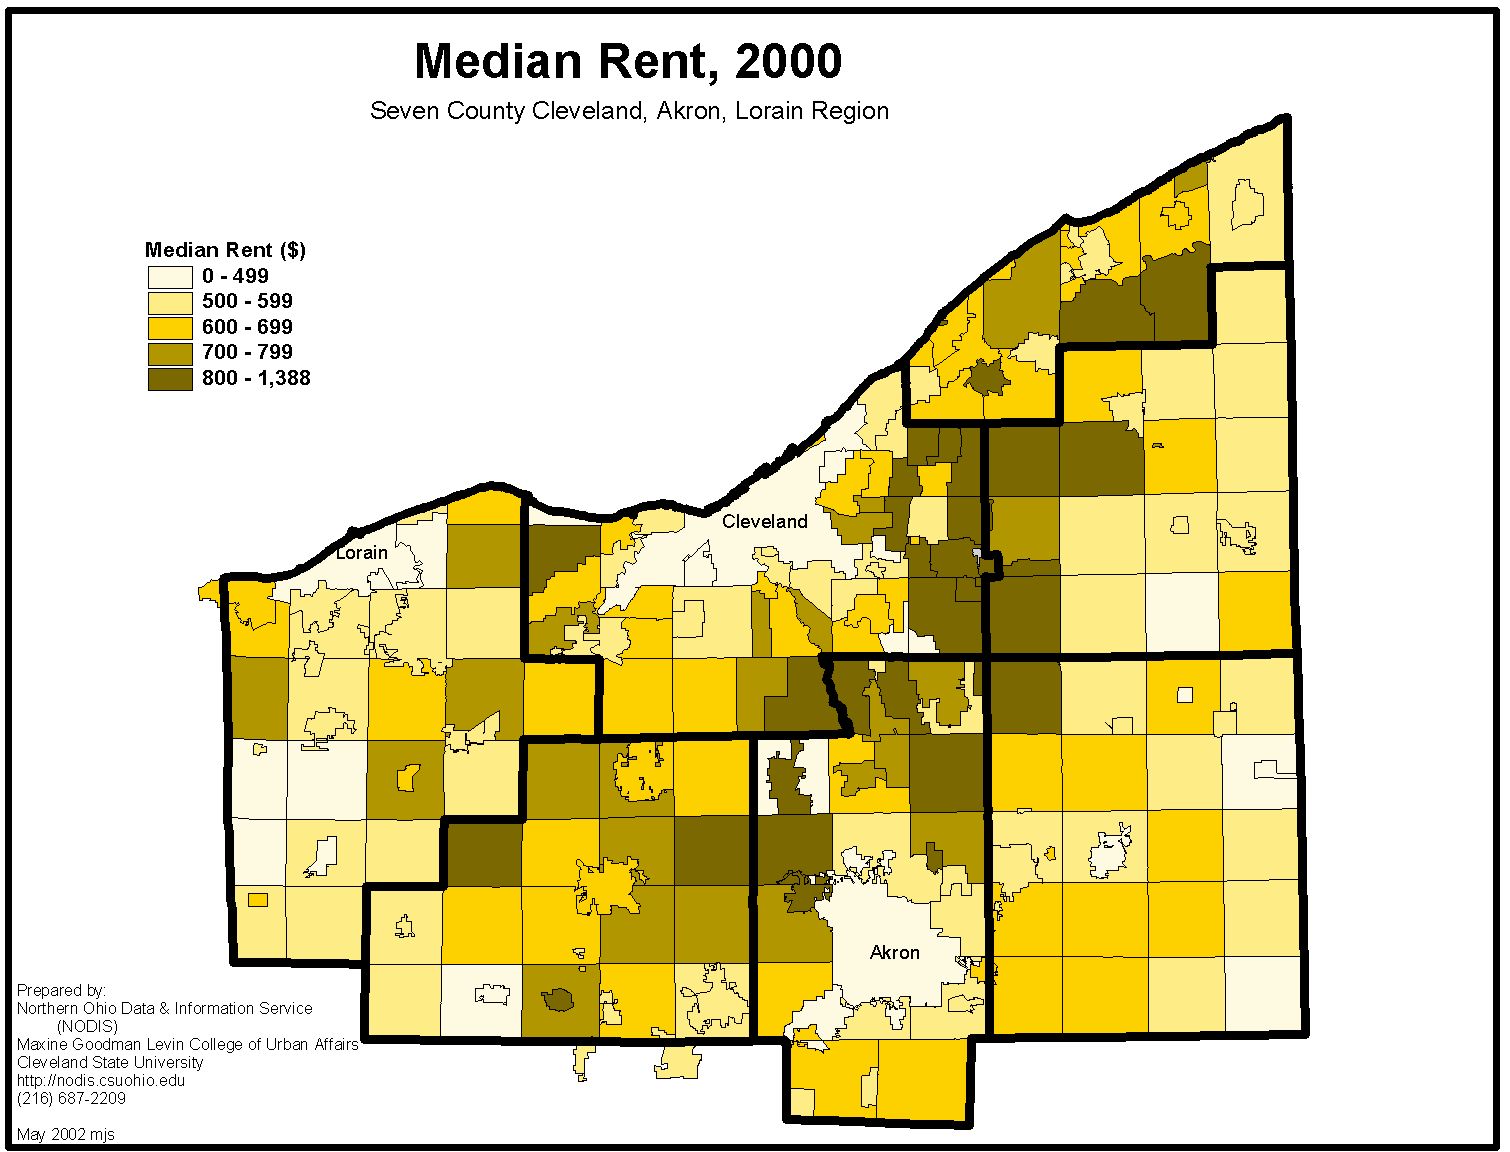 |
Percent Moved into Unit 1990 to March 2000 | 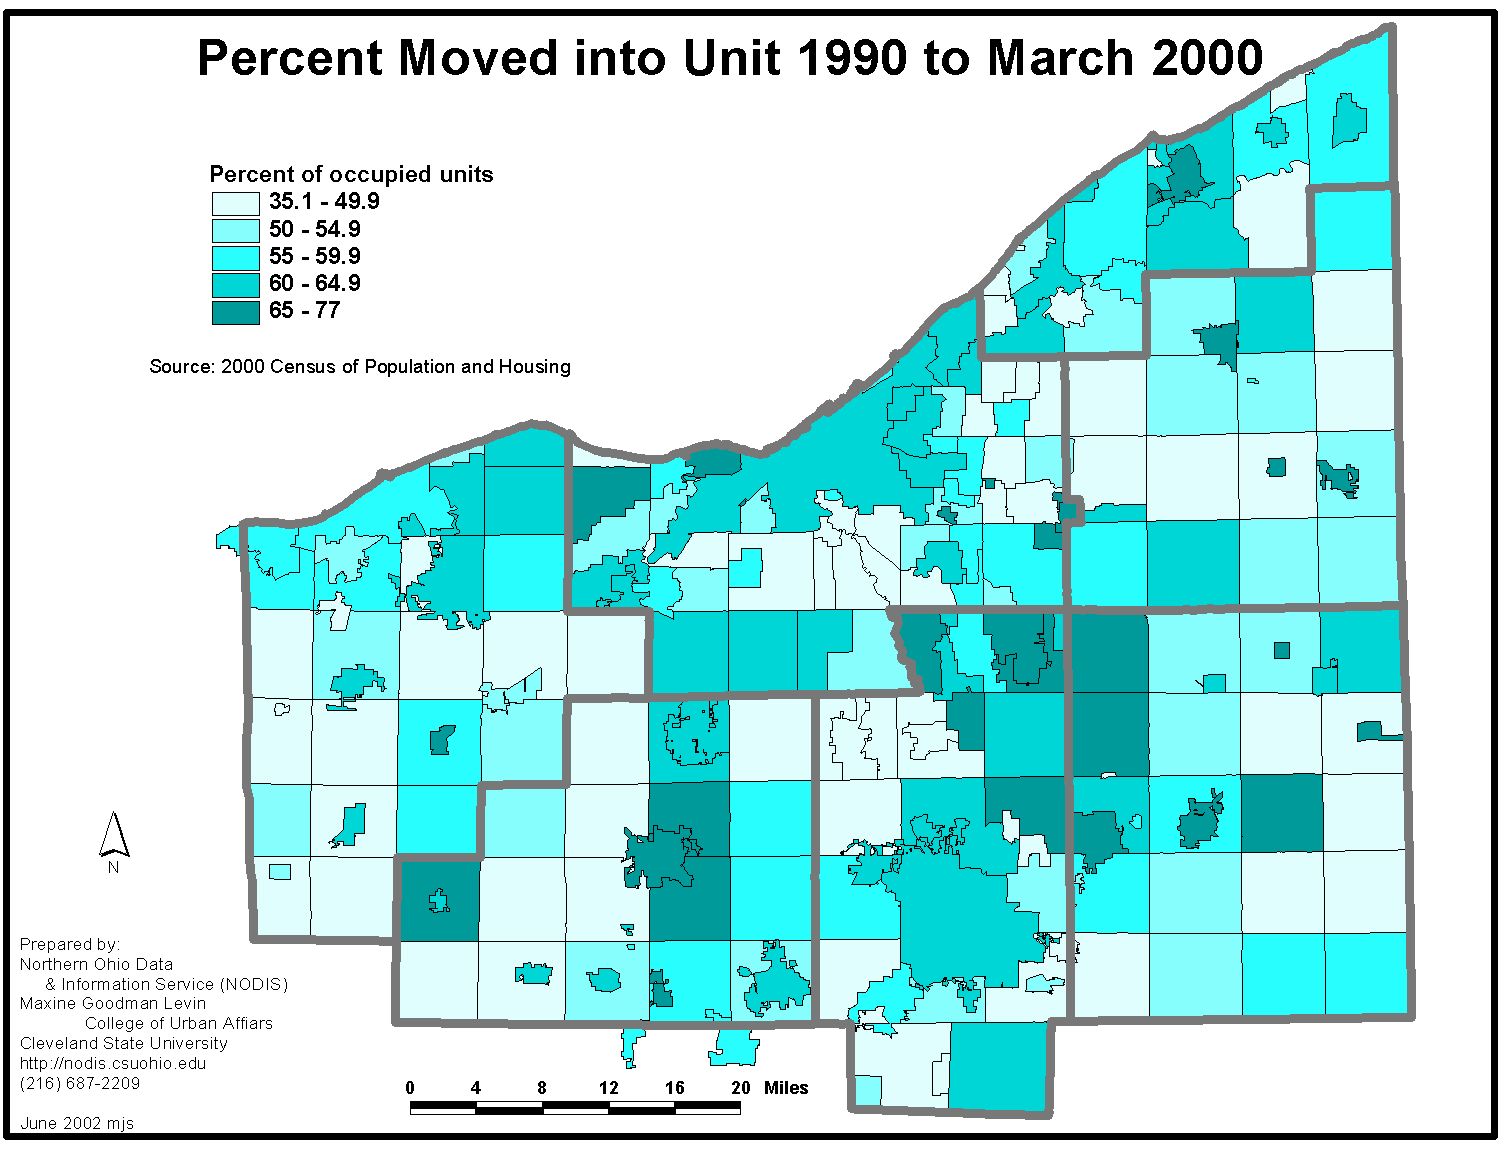 |
| Median Owner-Occupied Housing Value, 2000 | 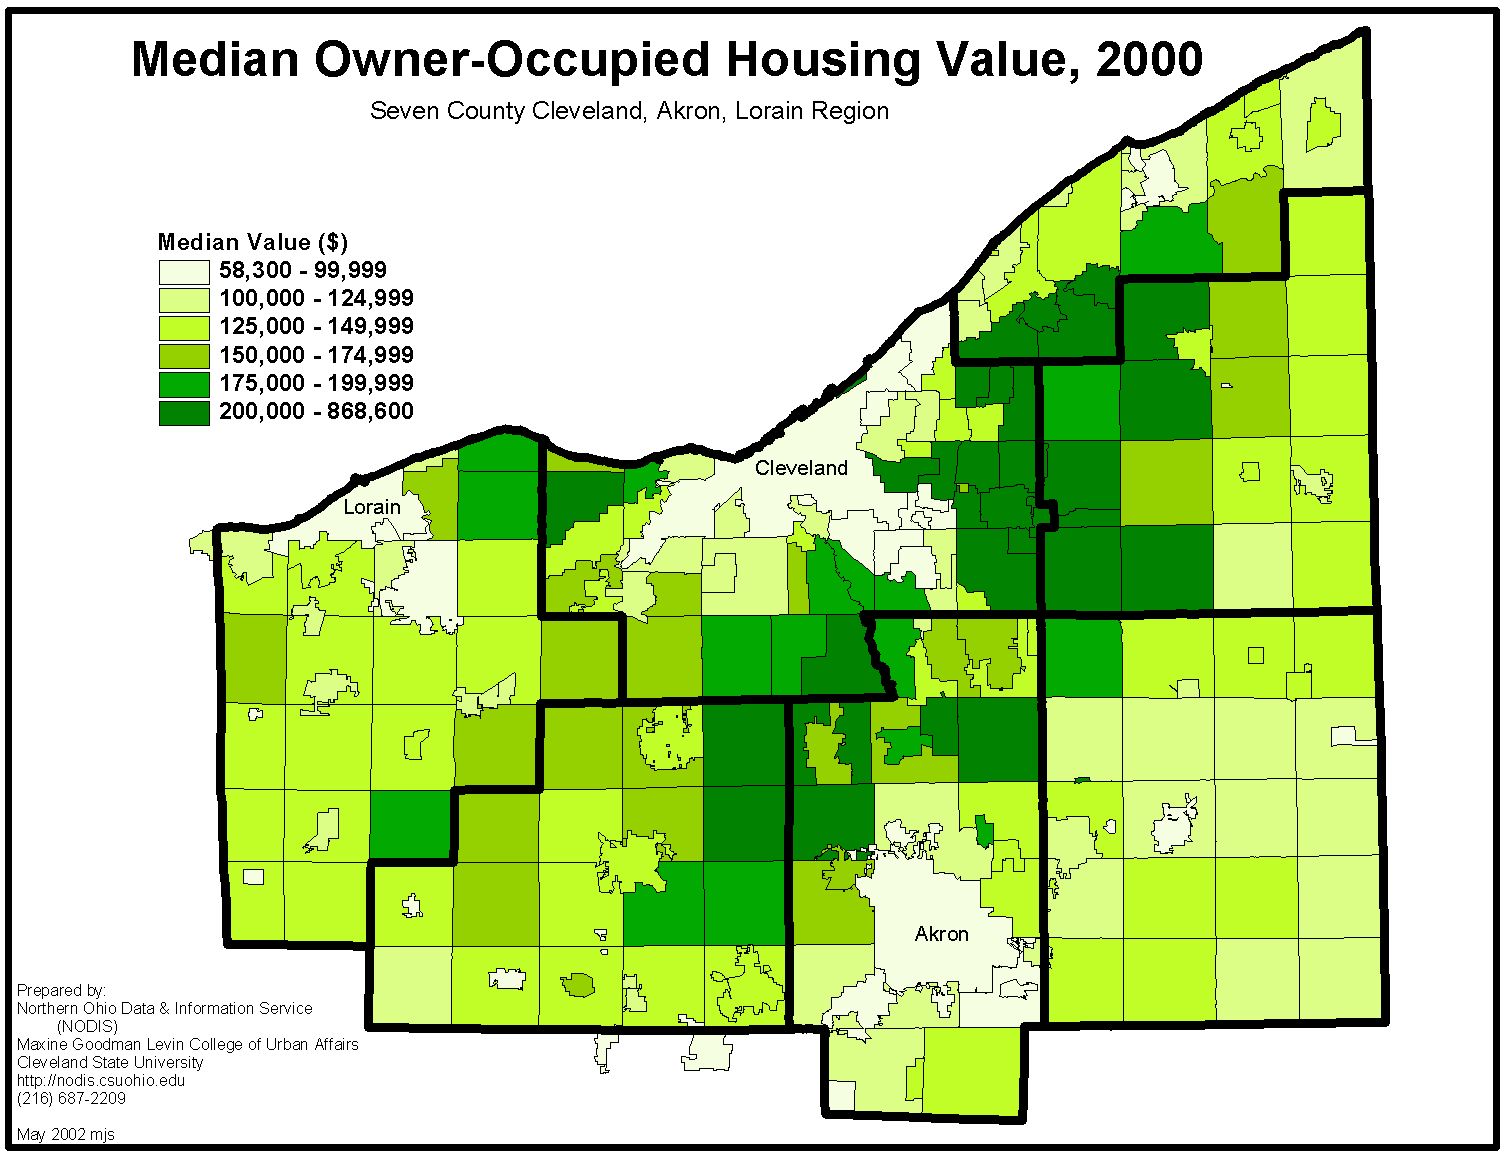 |
Percent Living in Different County in 1995 (for persons 5 years and older) | 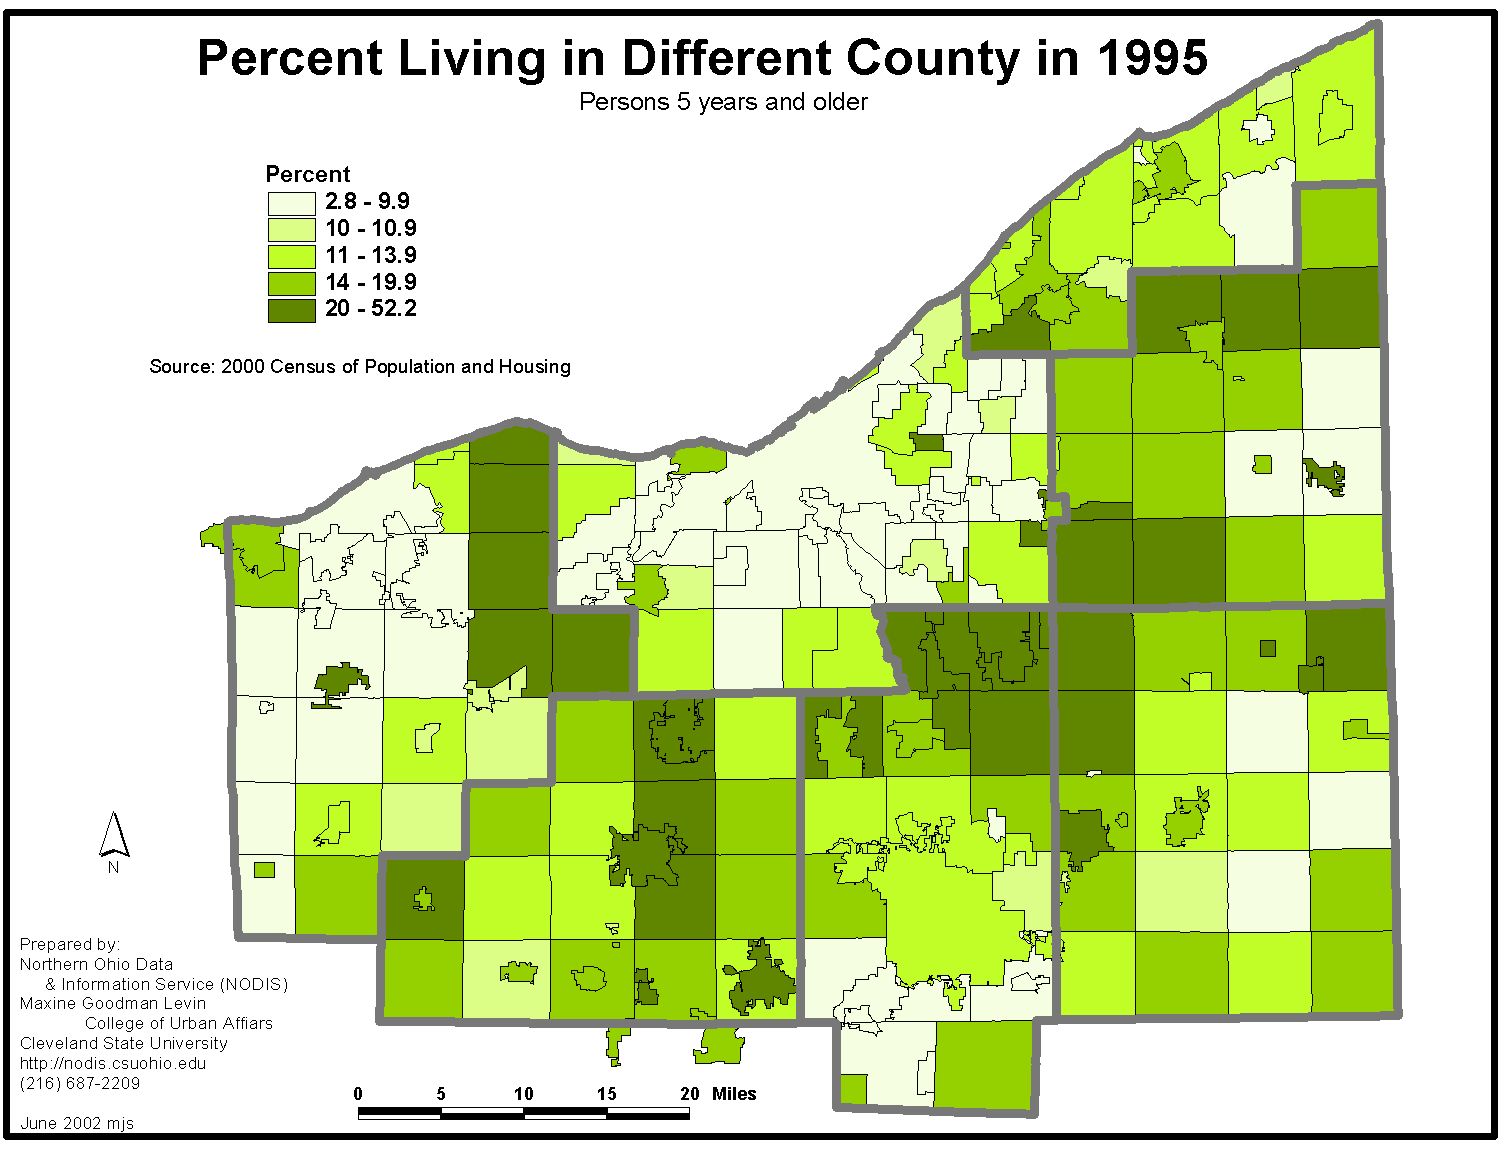 |
| Change in Total Population, 1990-2000 | 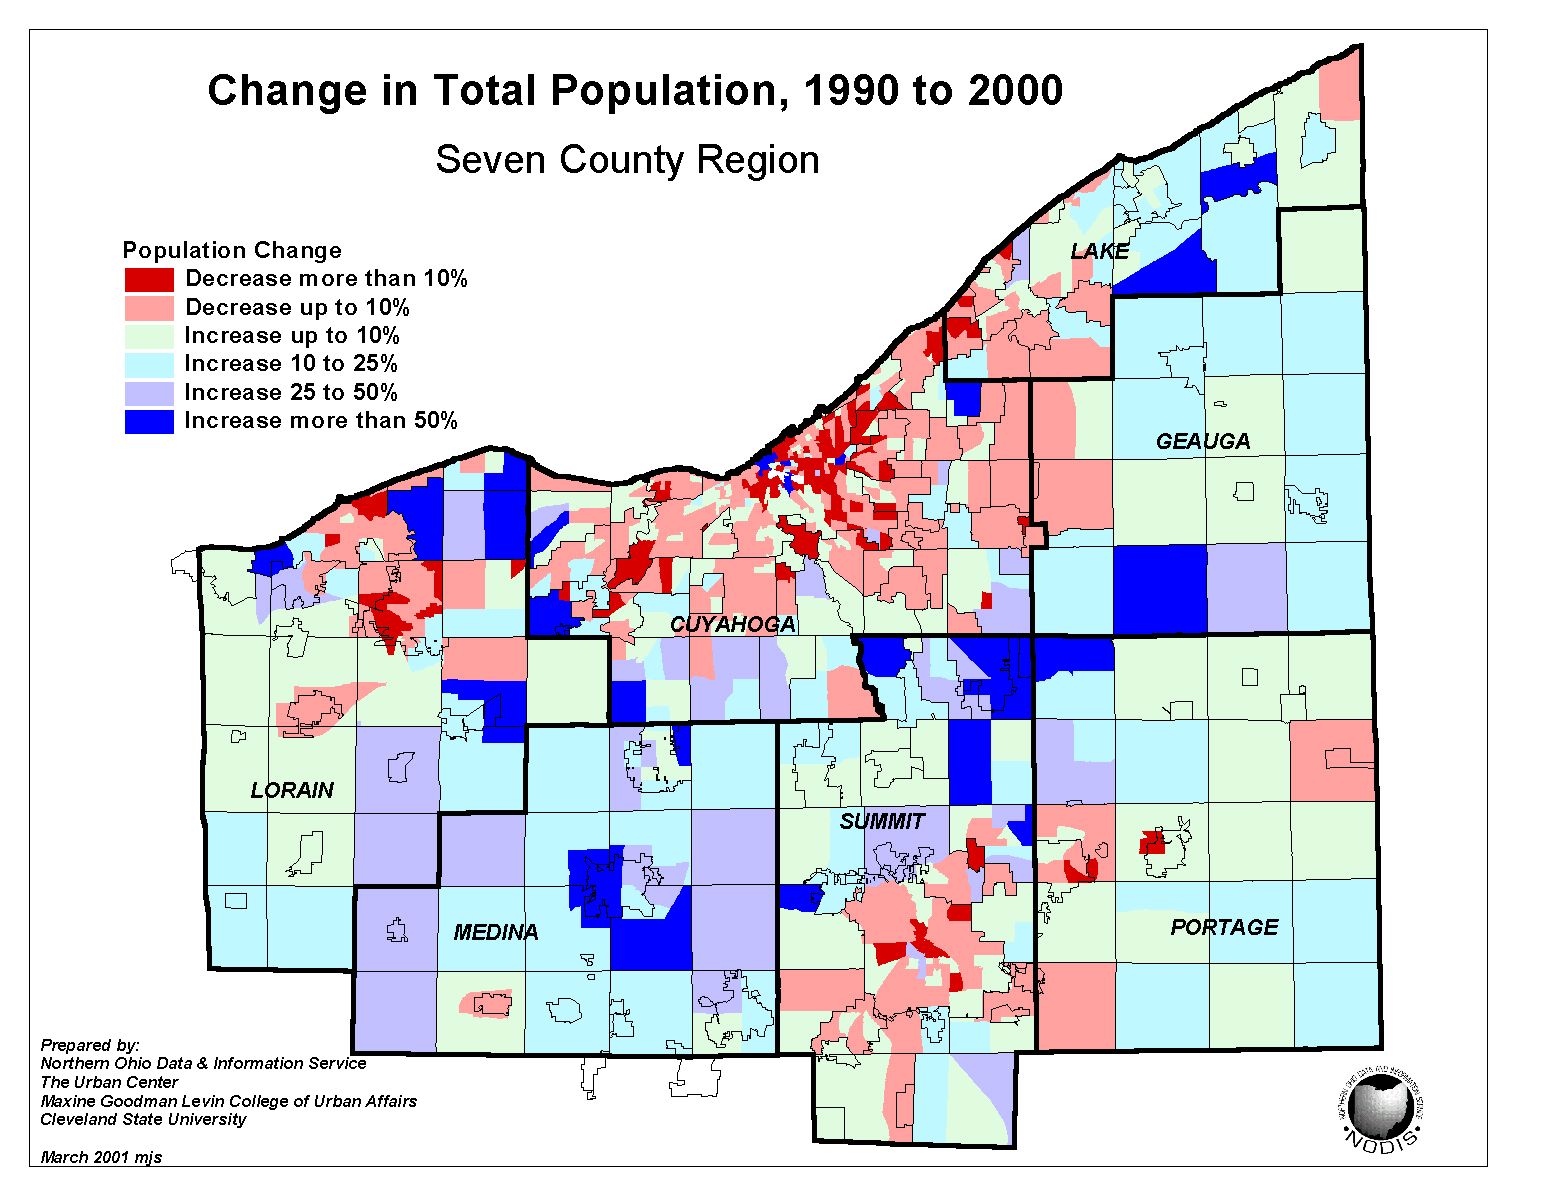 |
Change in Black Population 1990-2000 | 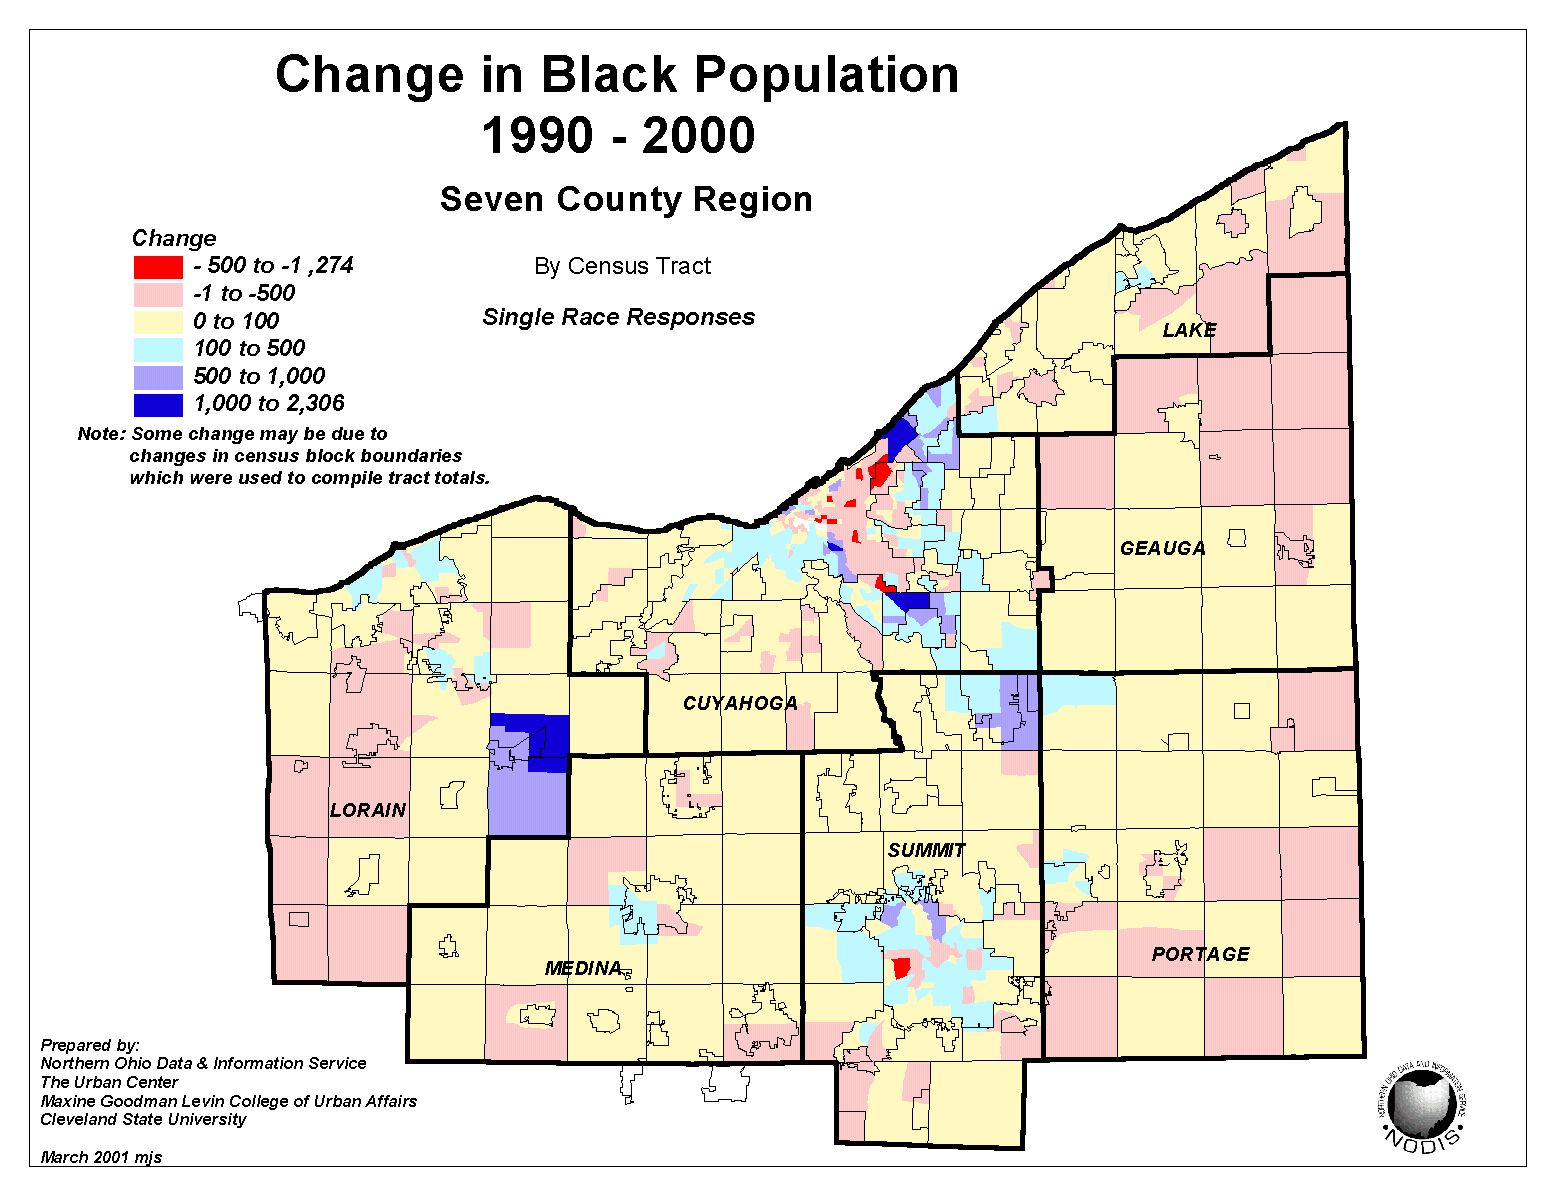 |
| Change in Population Density 1990-2000 | 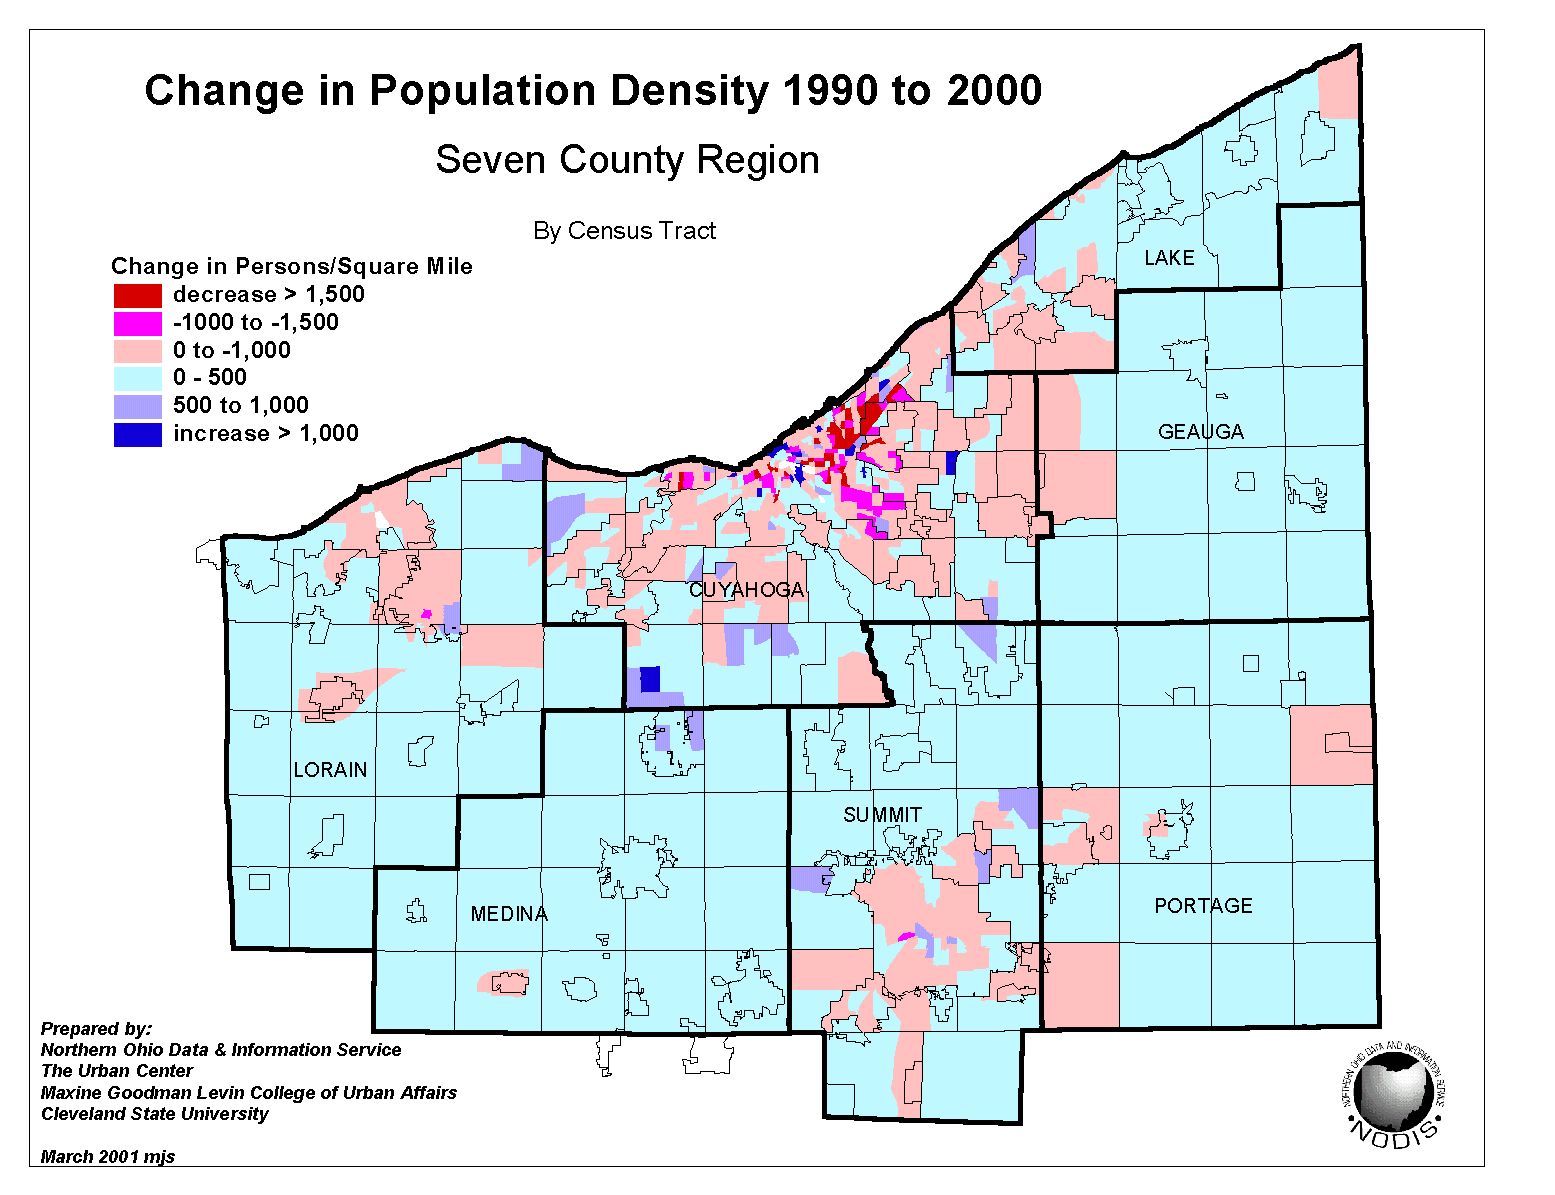 |
Percent Persons Indicating 2 or more Races - 2000 Census of Population | 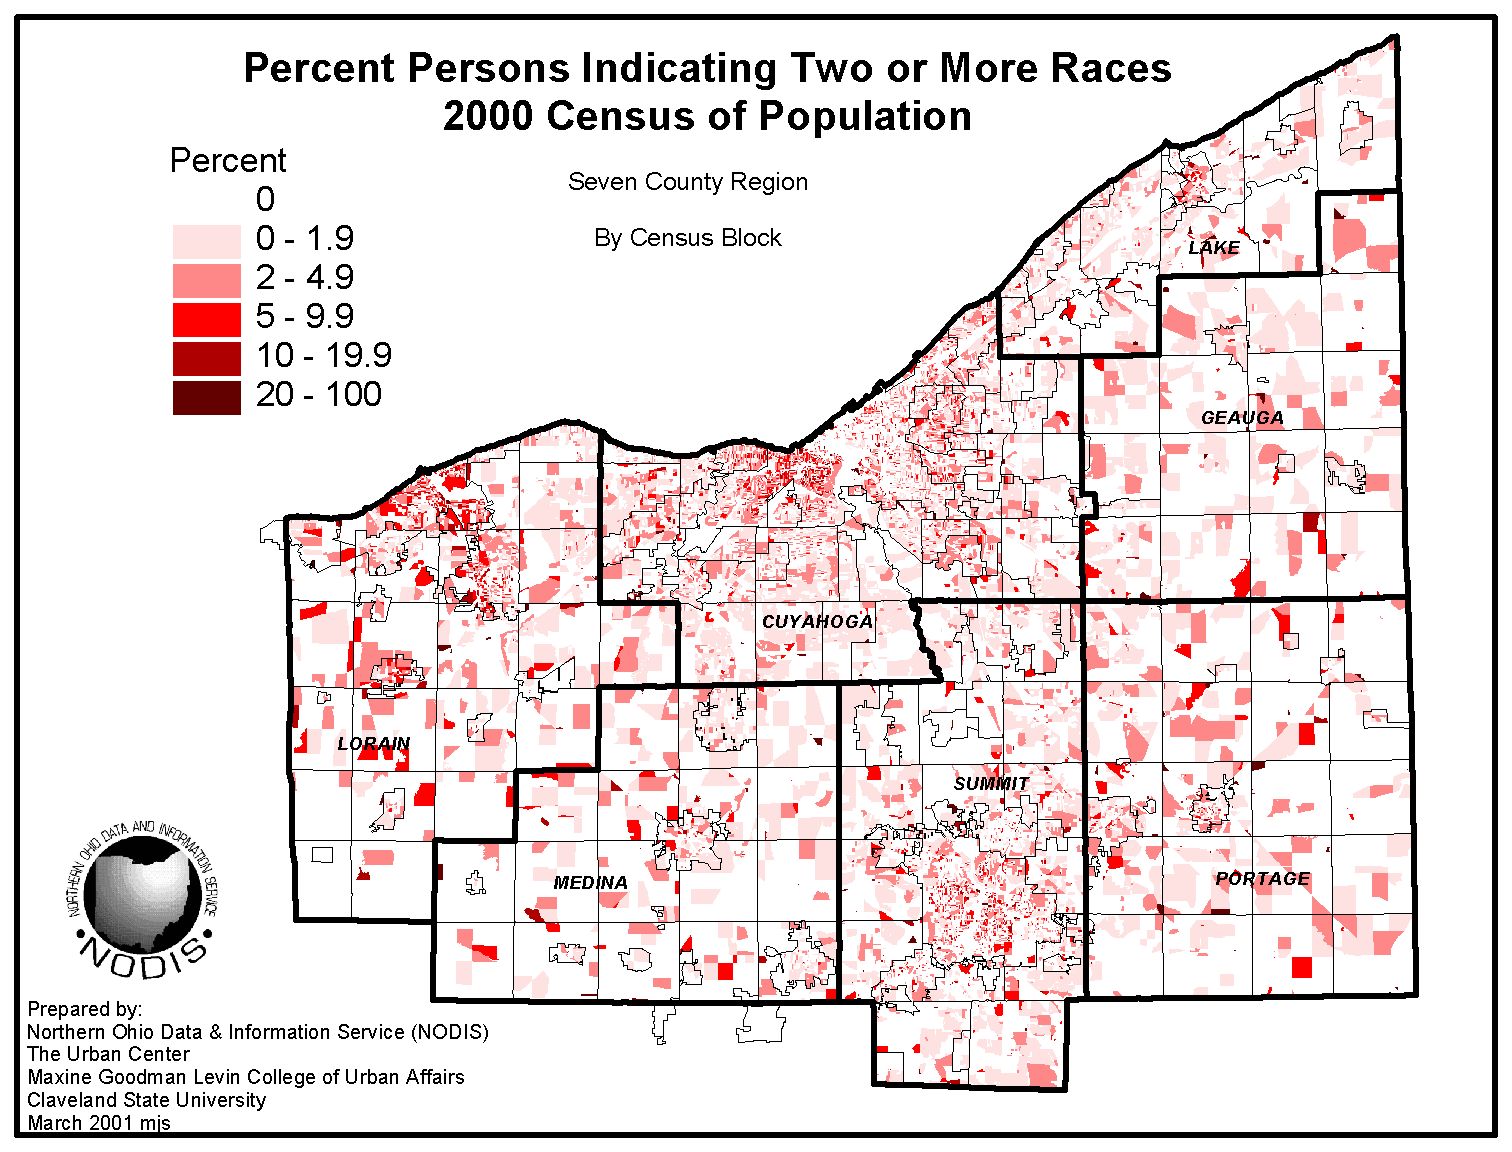 |
| Population Density, 2000 | 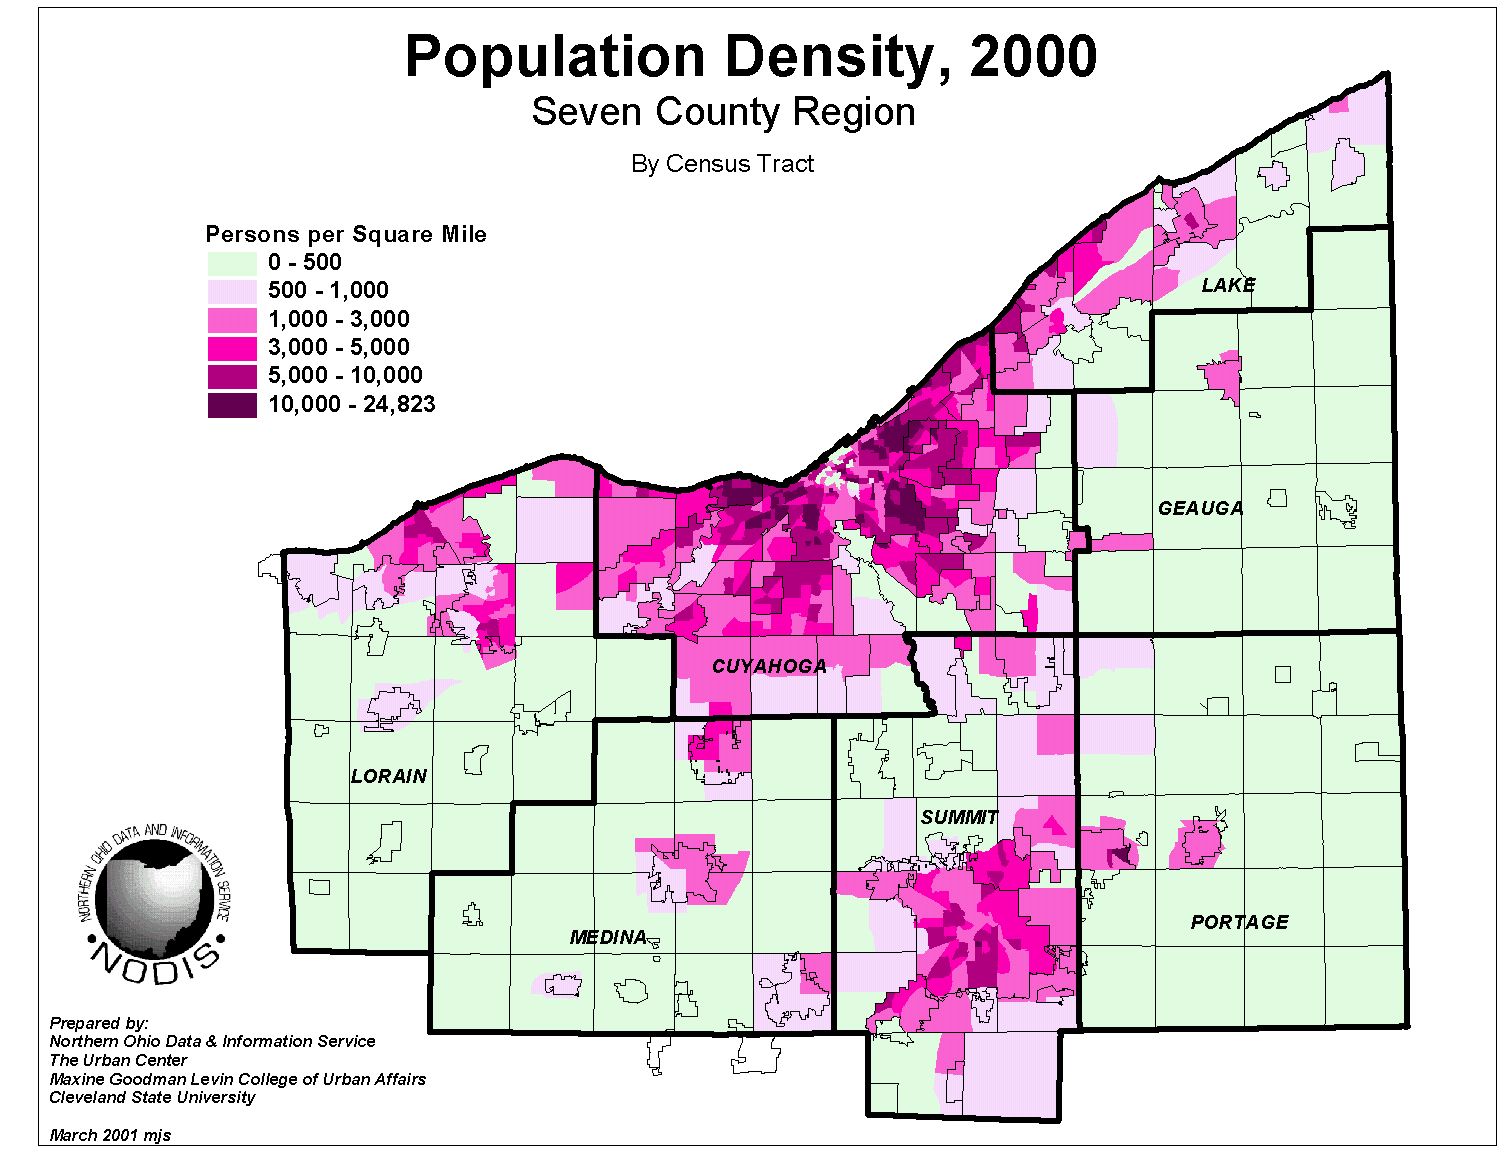 |
Change in Children per Square Mile 1990-2000 | 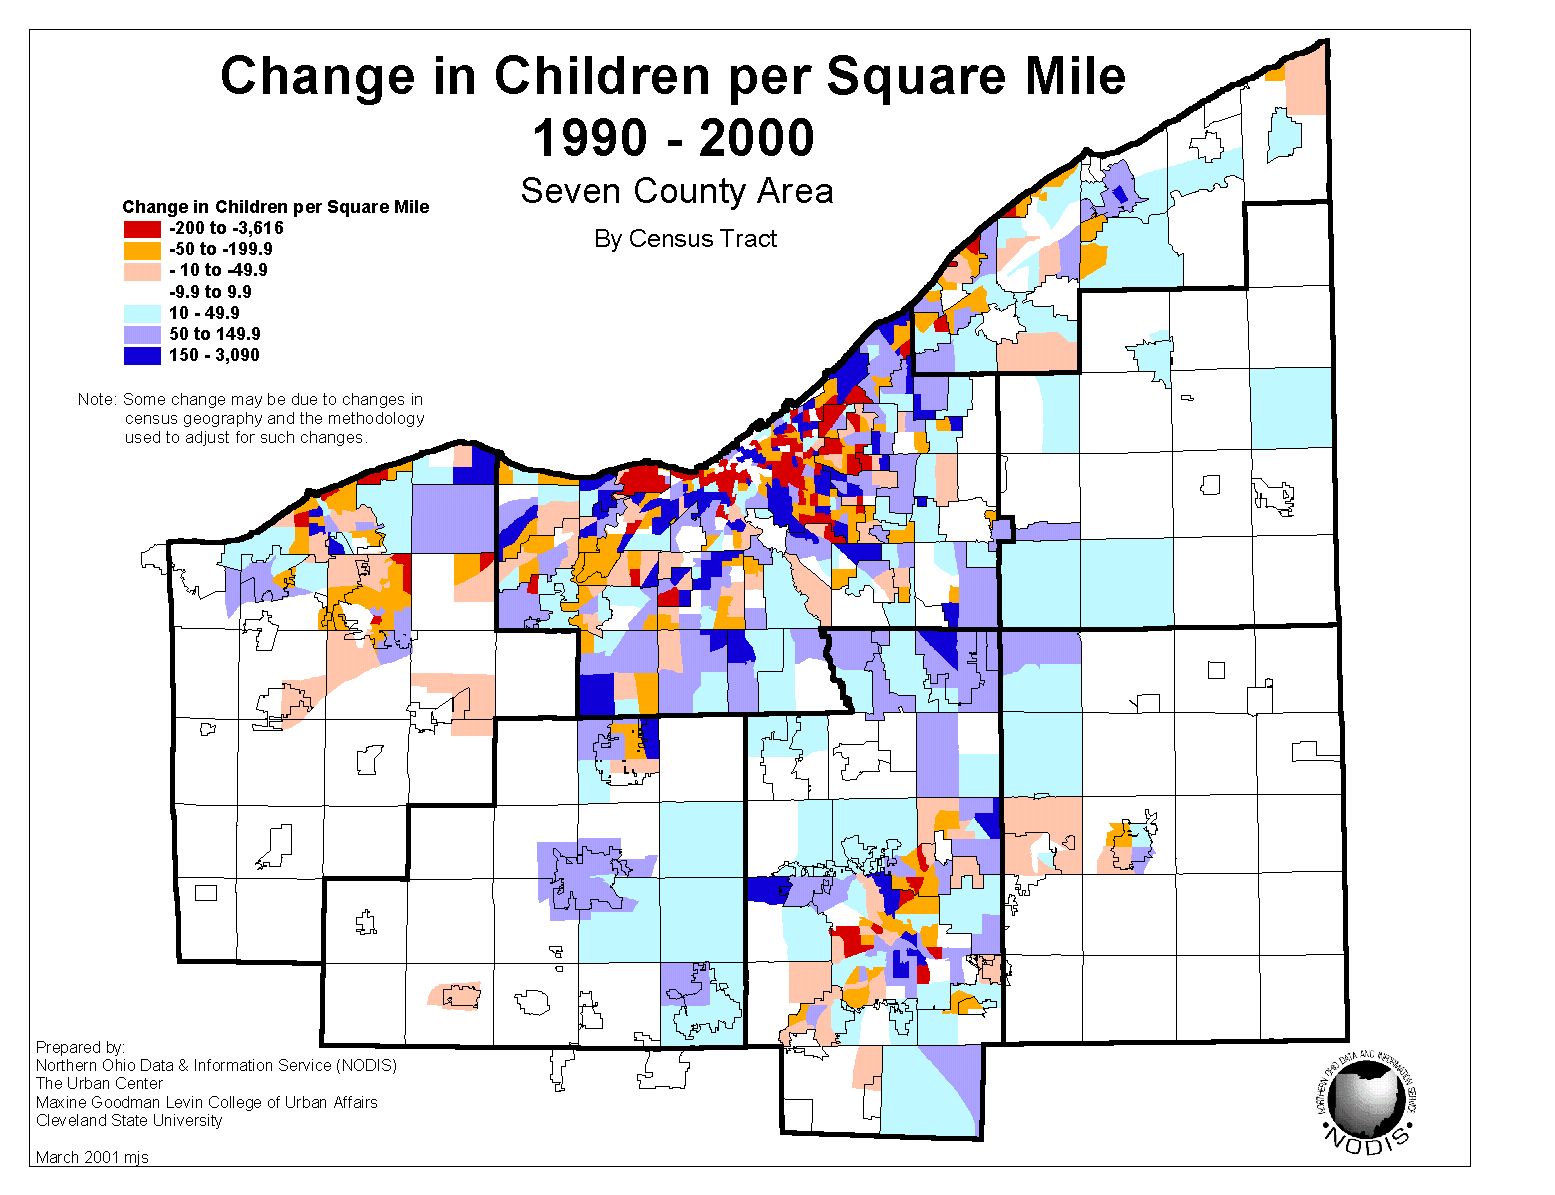 |
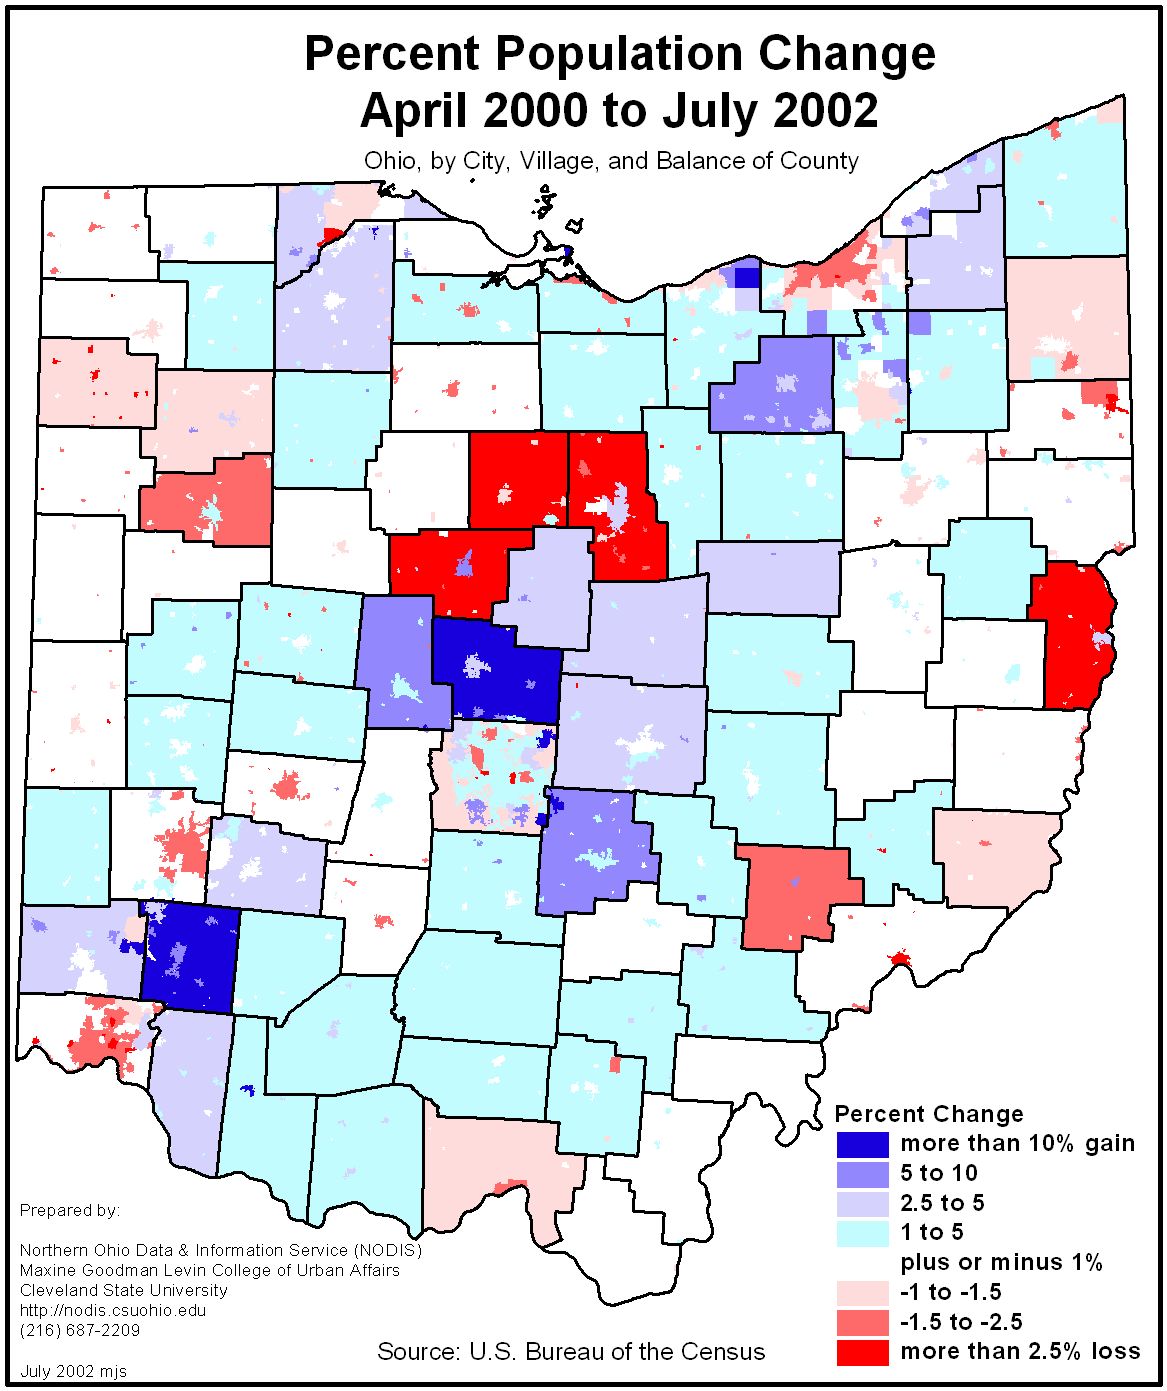
| Percent Population Change April 2000 to July 2002 - By City, Village, and Balance of County | 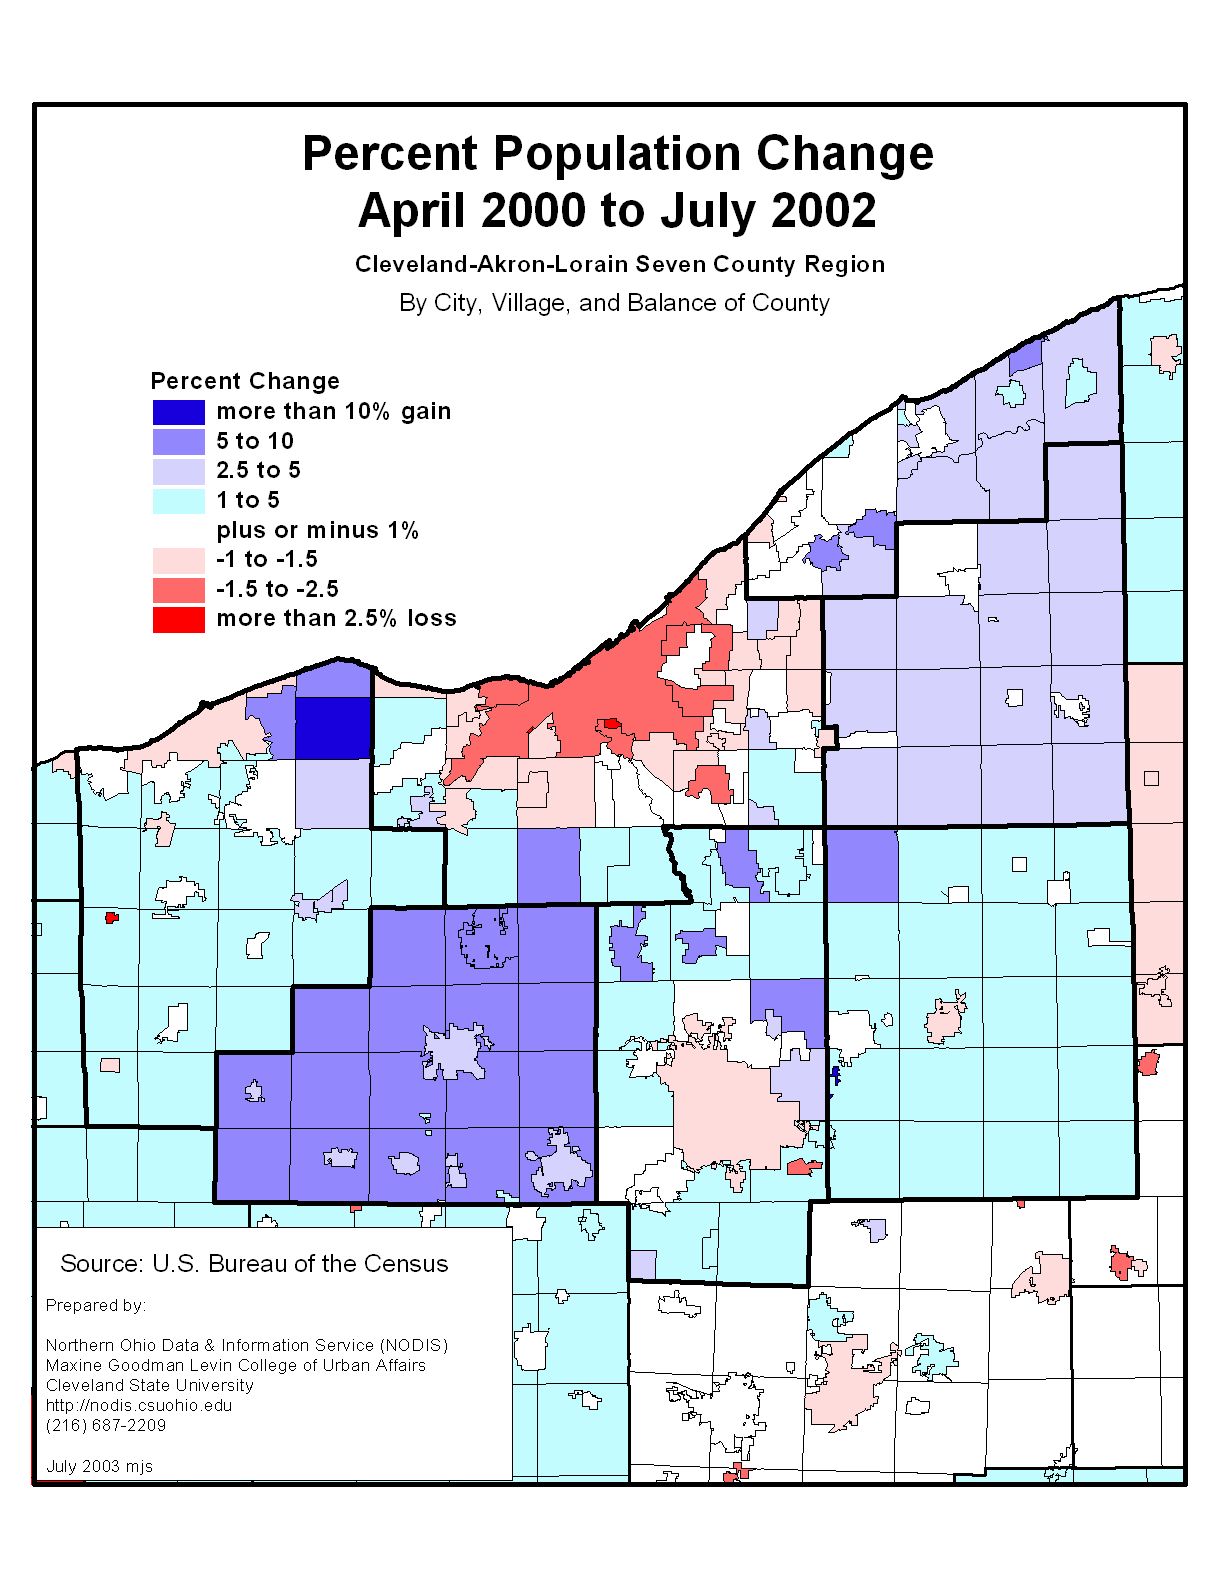 |
Percent Change in Children 1990-2000 | 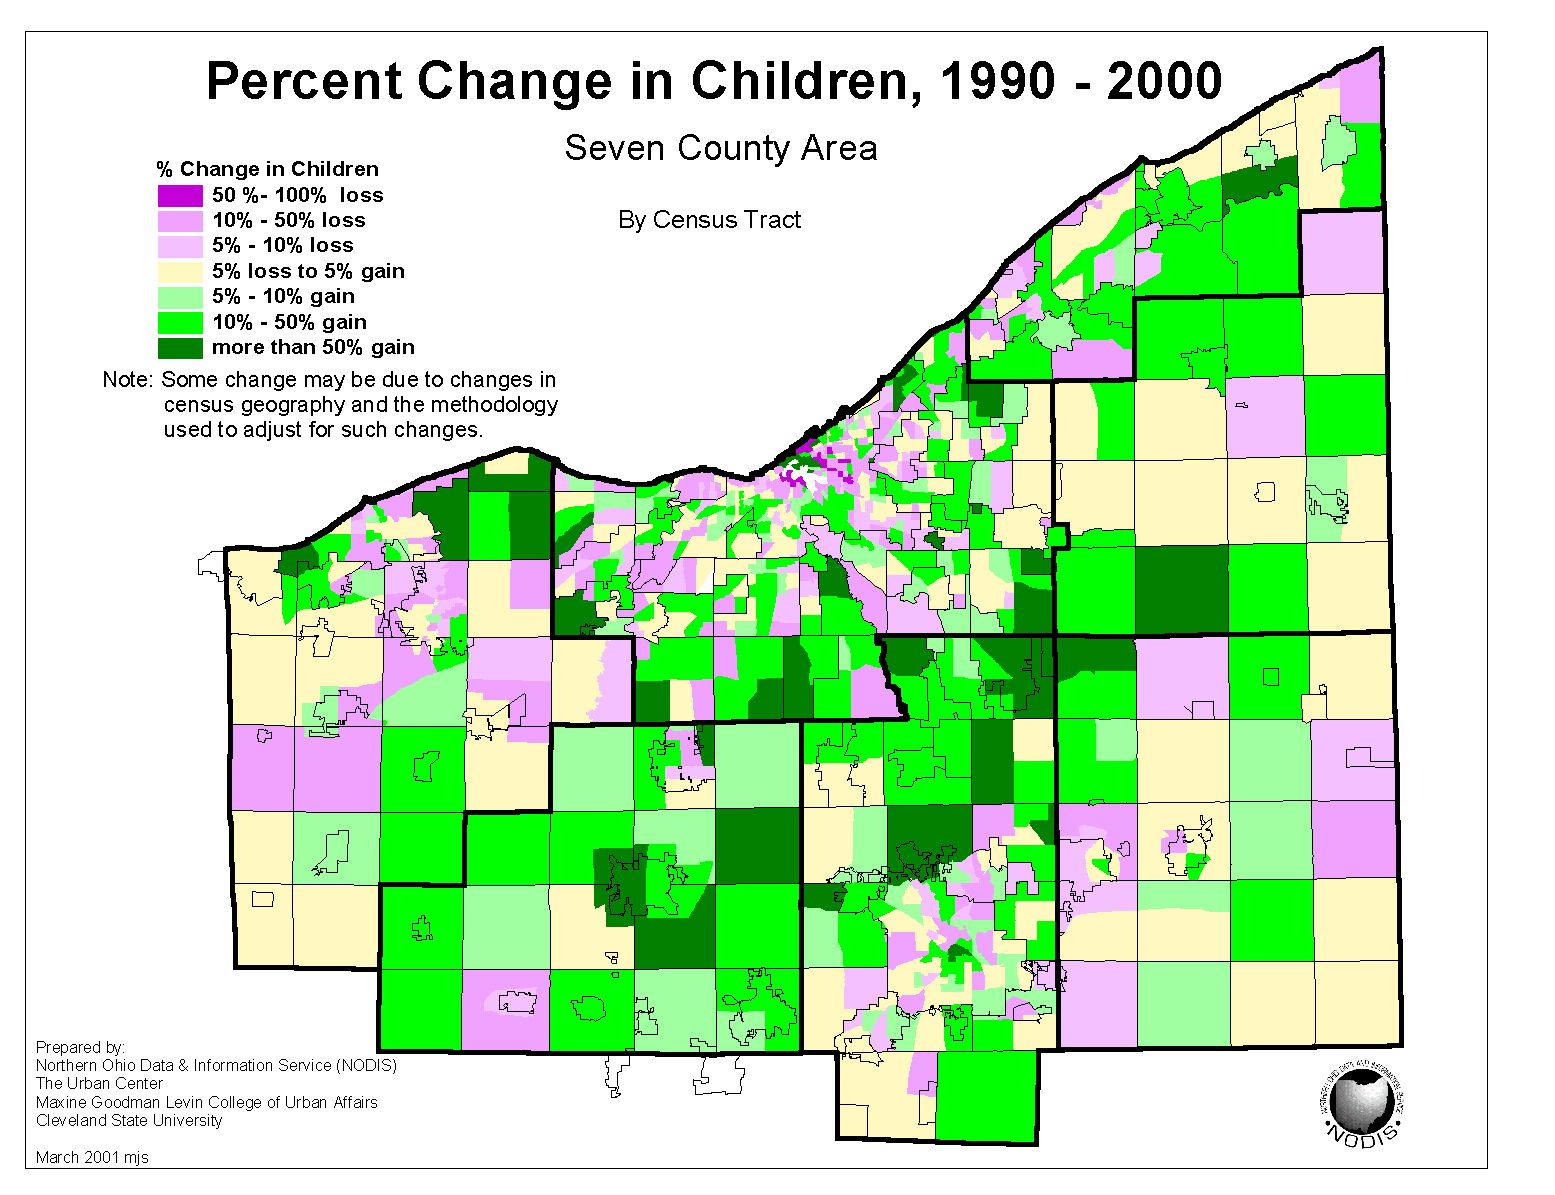 |
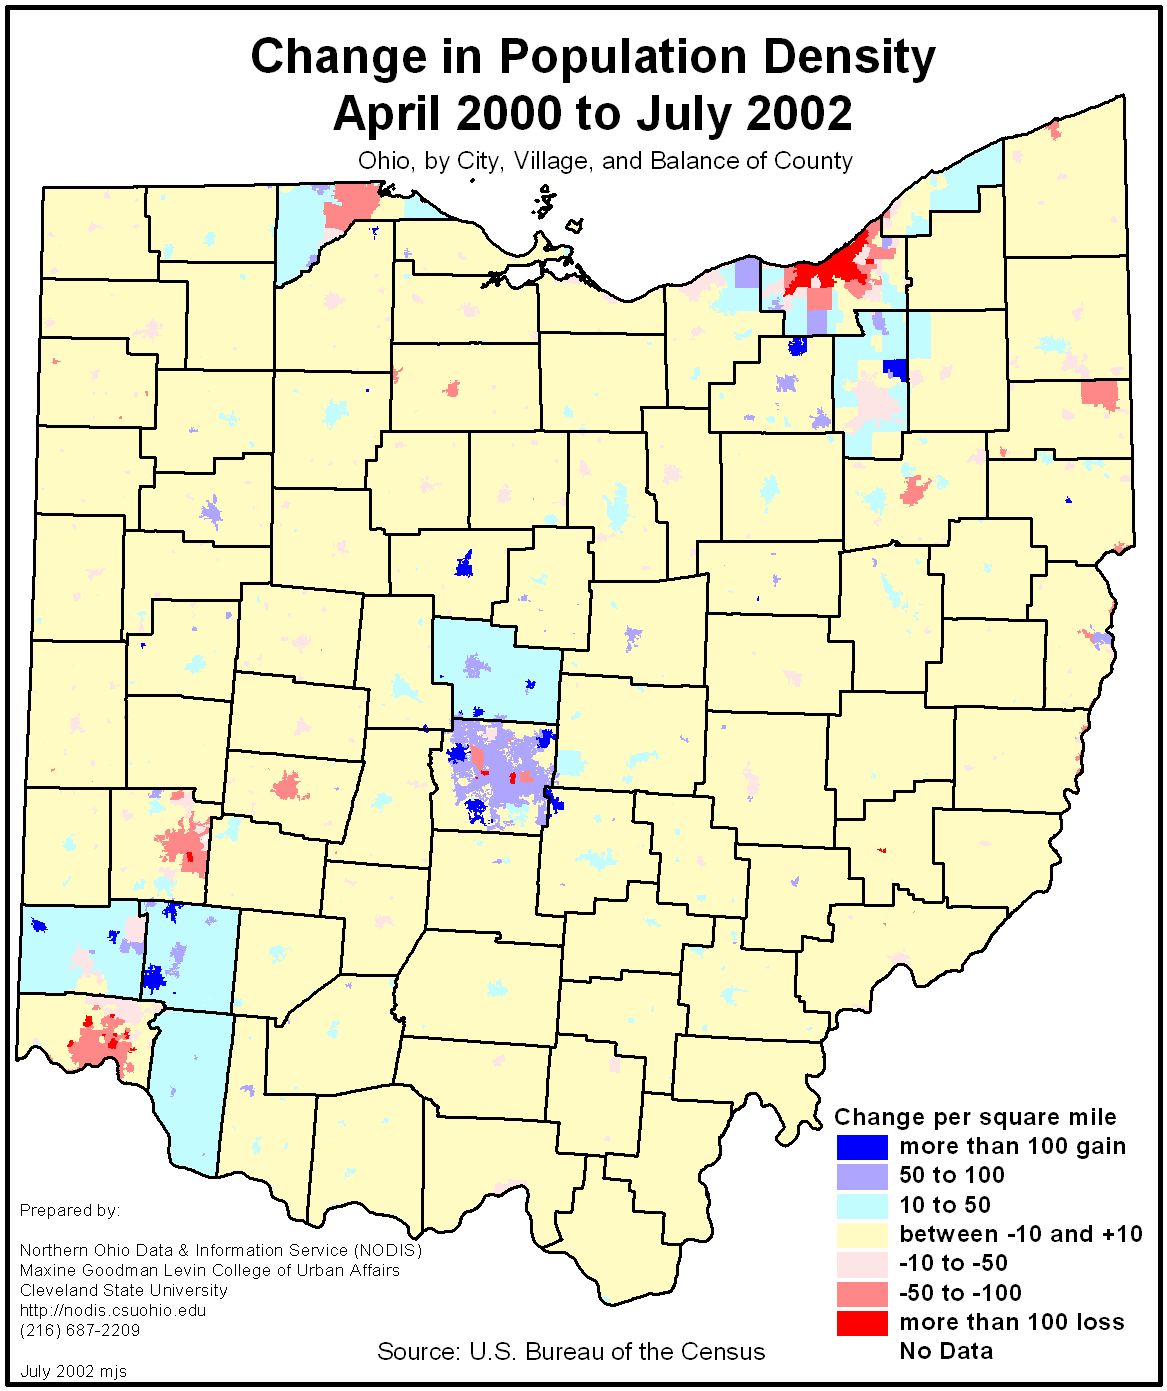
| Change in Population Density April 2000 to July 2002 - By City, Village, and Balance of County | 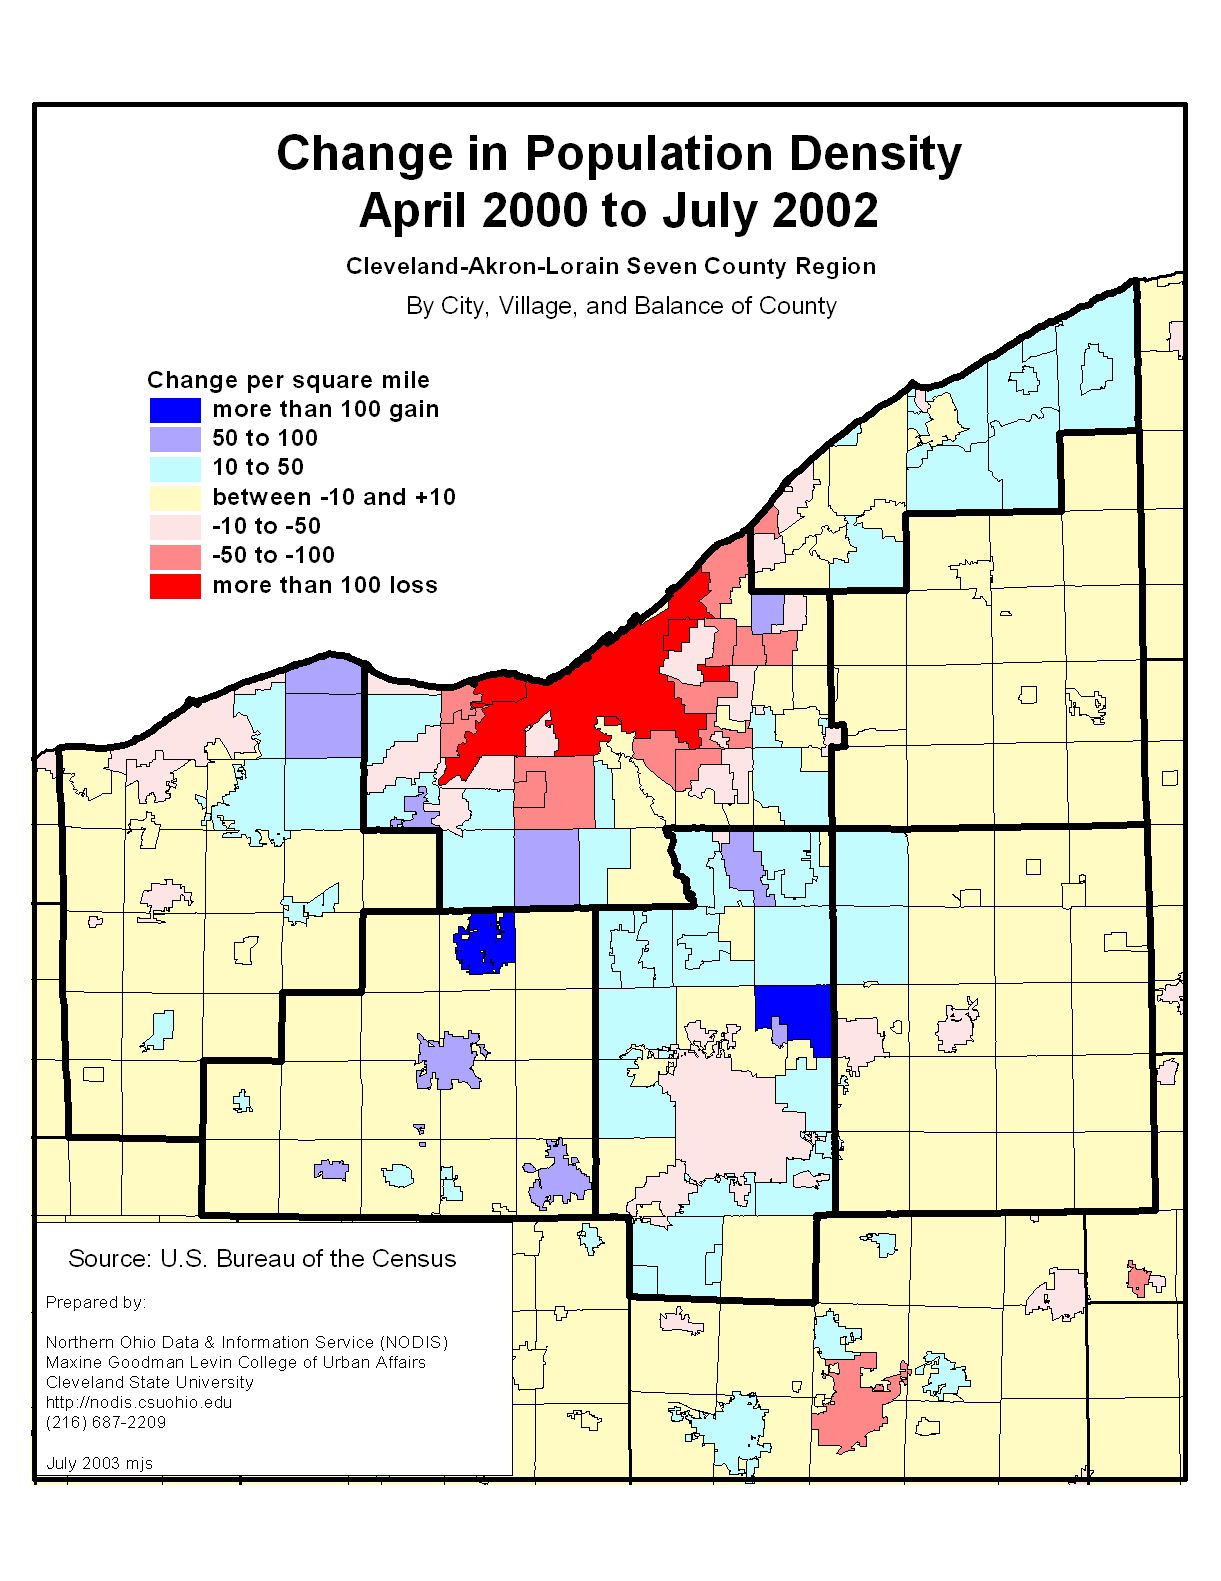 |
Population Density for Hispanic Population, 2000 | 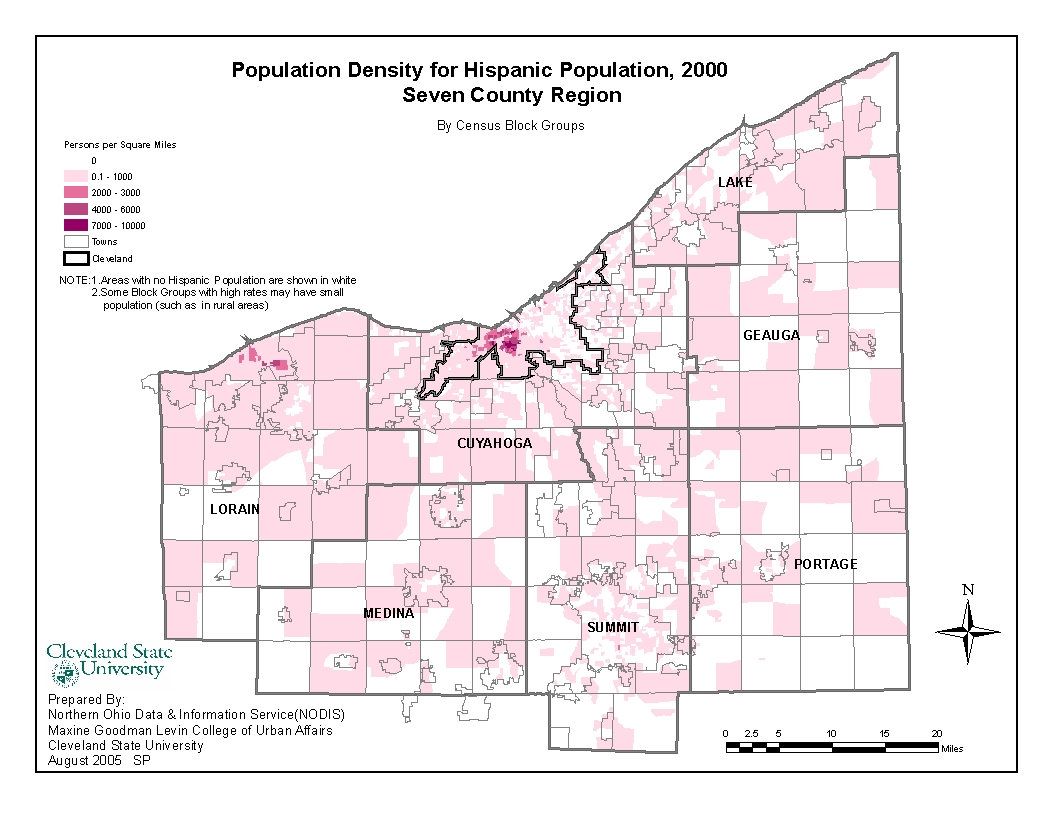 |
| Poverty Rate for White Population, 2000 | 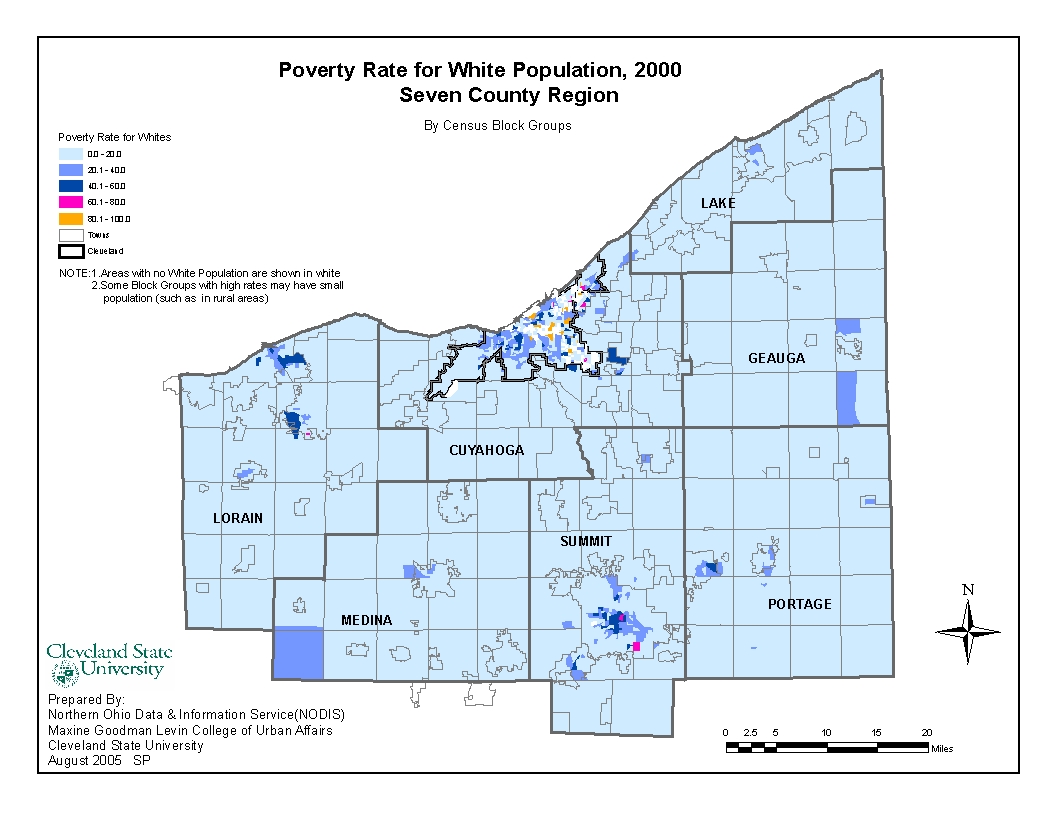 |
Poverty Rate for Hispanic Population, 2000 | 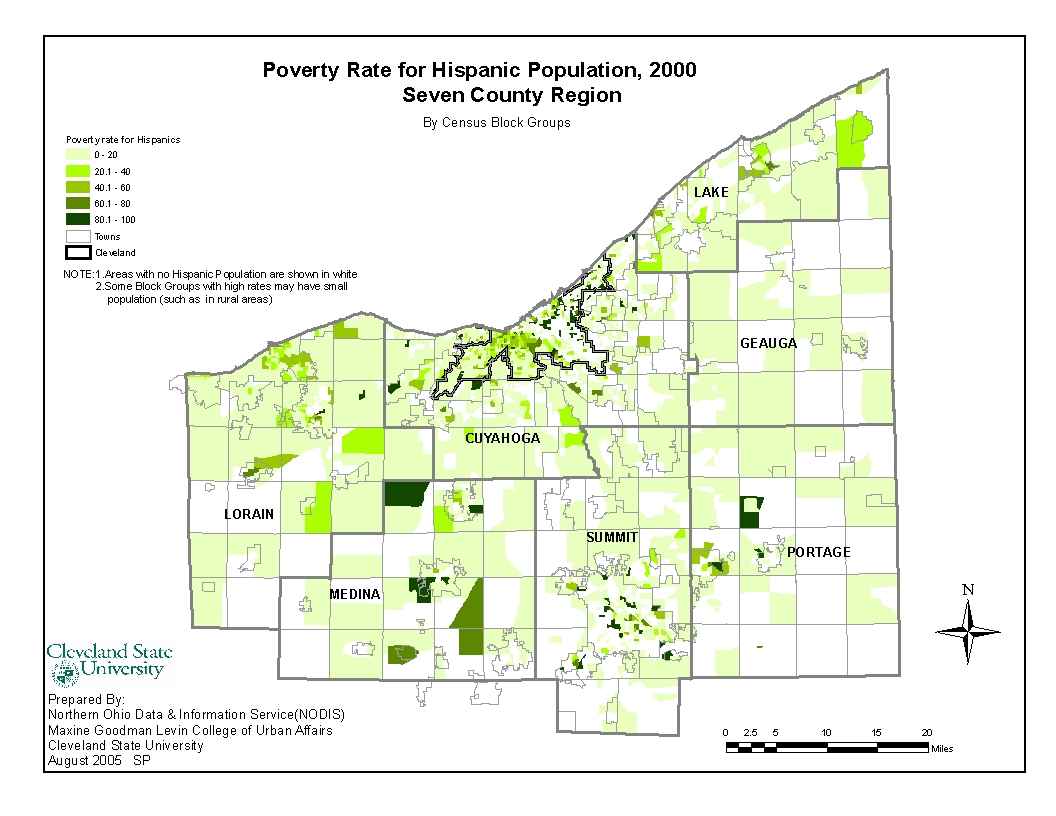 |
| Poverty Rate for Black Population, 2000 | 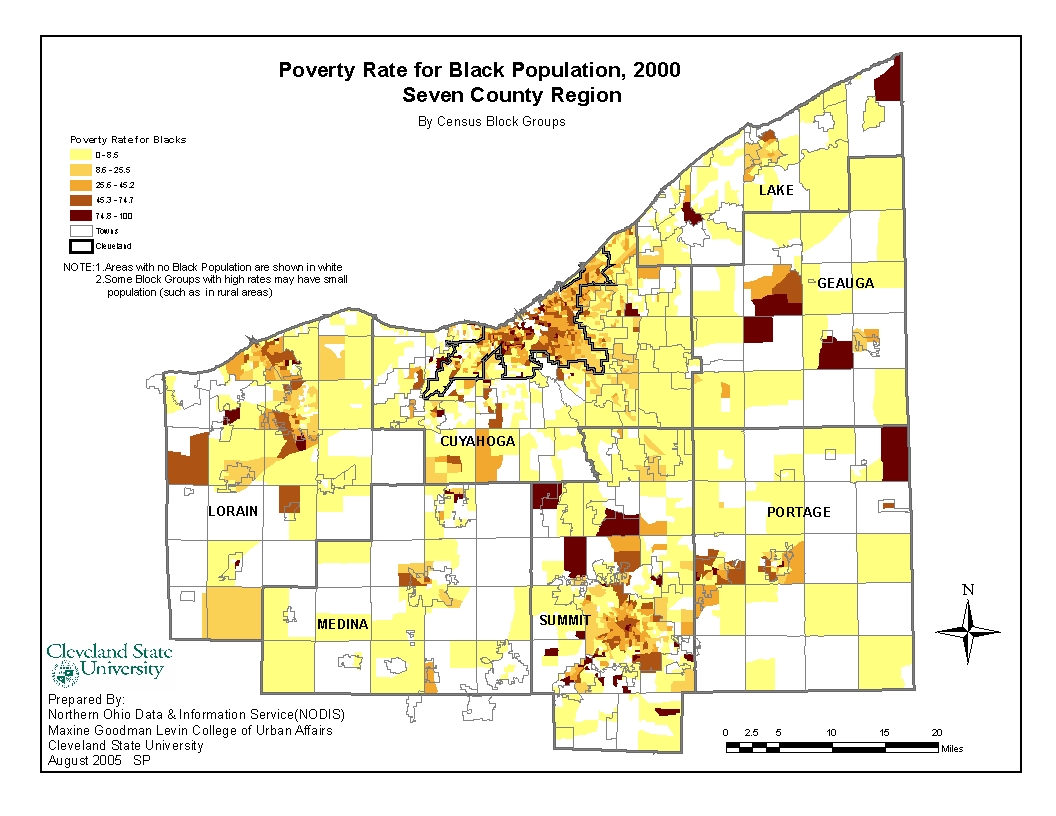 |
Cleveland-Akron-Lorain CMSA Maps
| Percent of Children Aged 6-17 Living with Mother Only in the Labor Force | 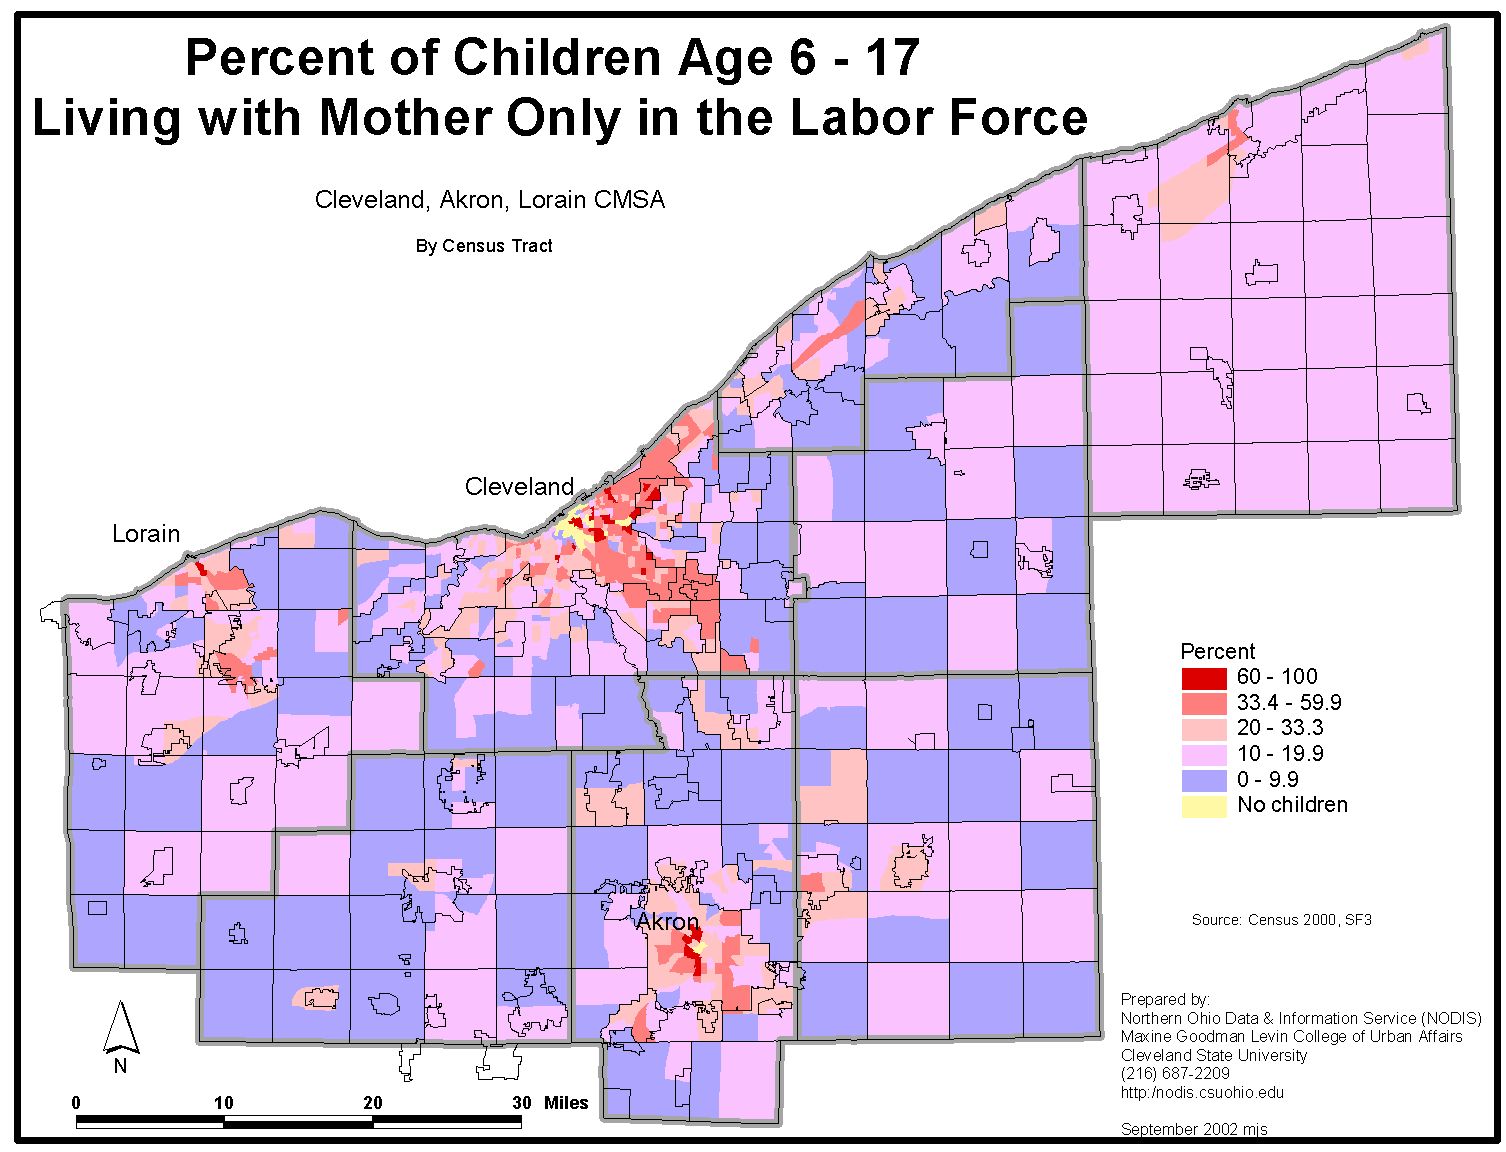 |
Percent Working Part-Time | 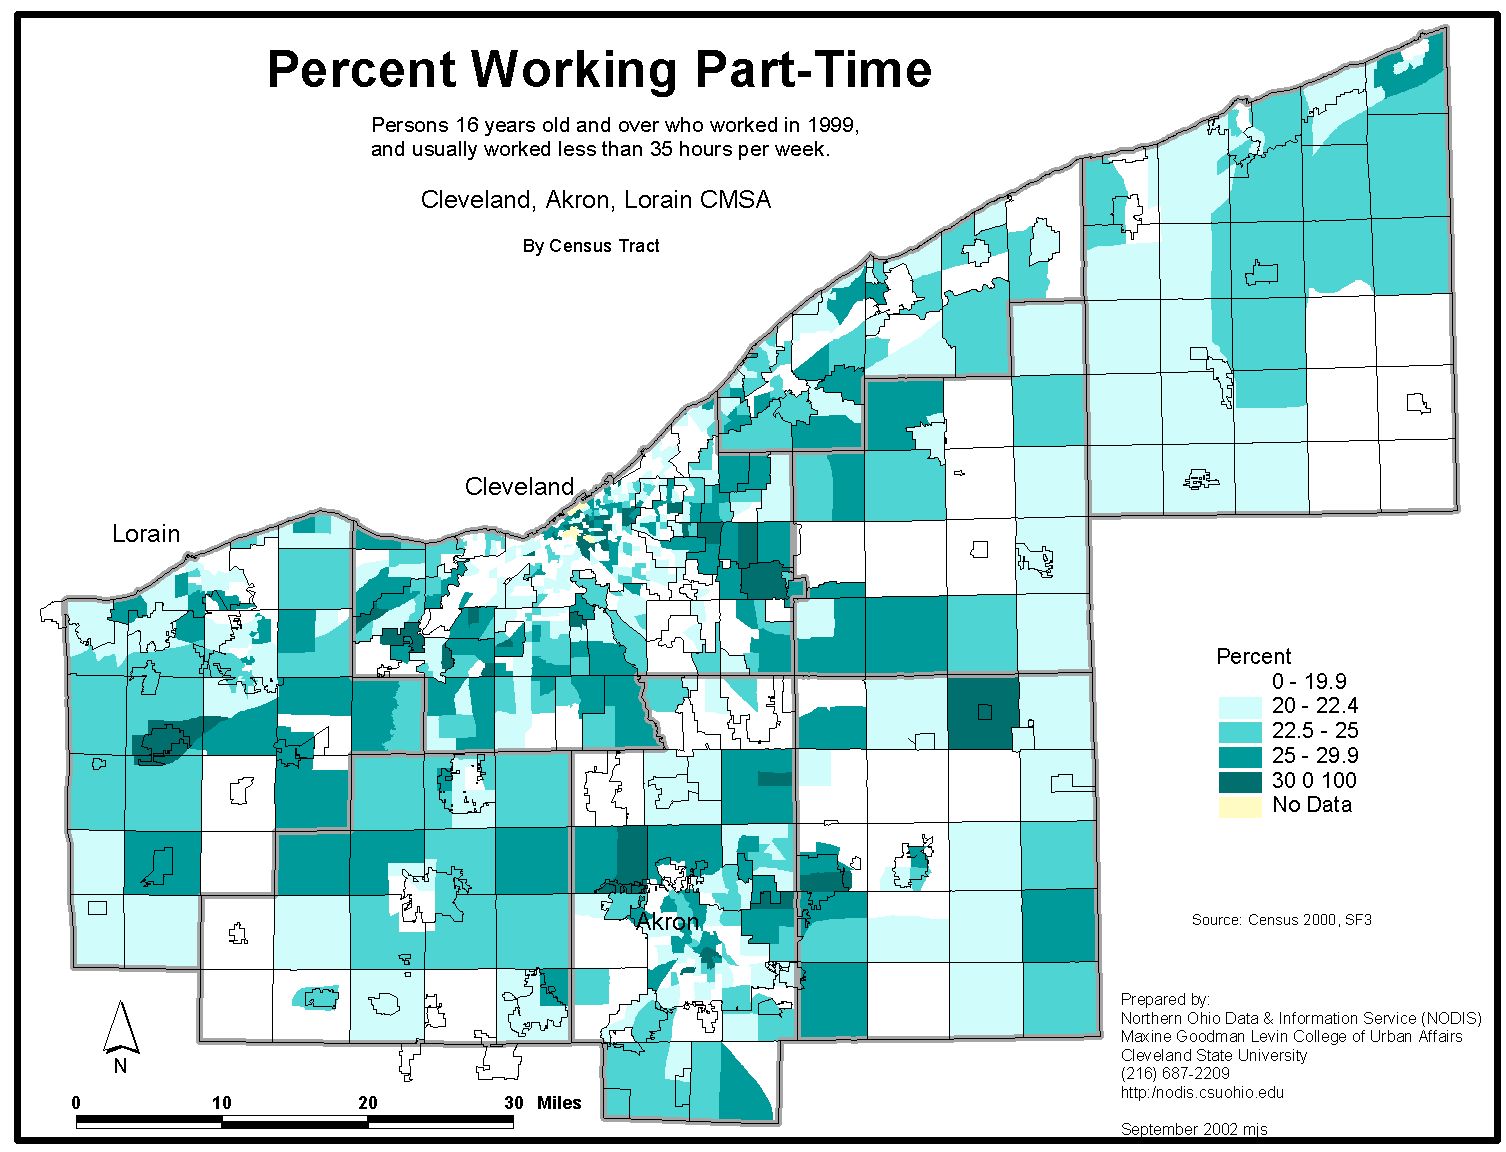 |
| Percent Children Under 6 Living with Mother Only in the Labor Force | 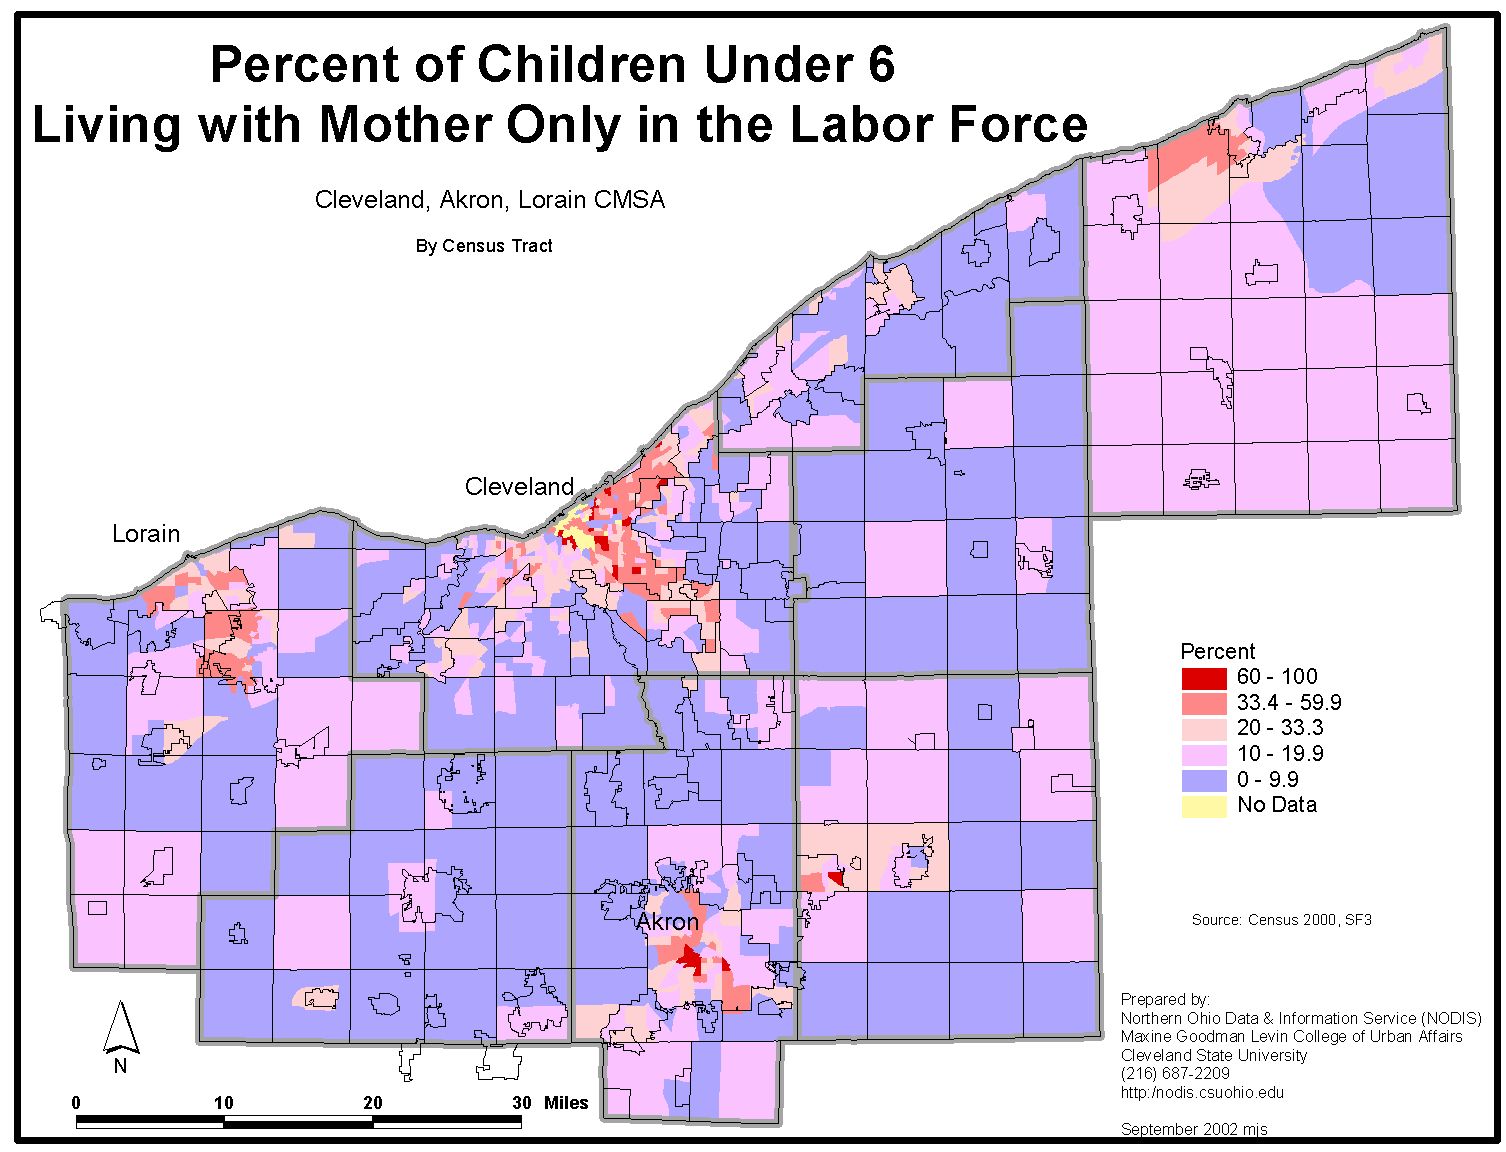 |
Percent of Families with One Worker | 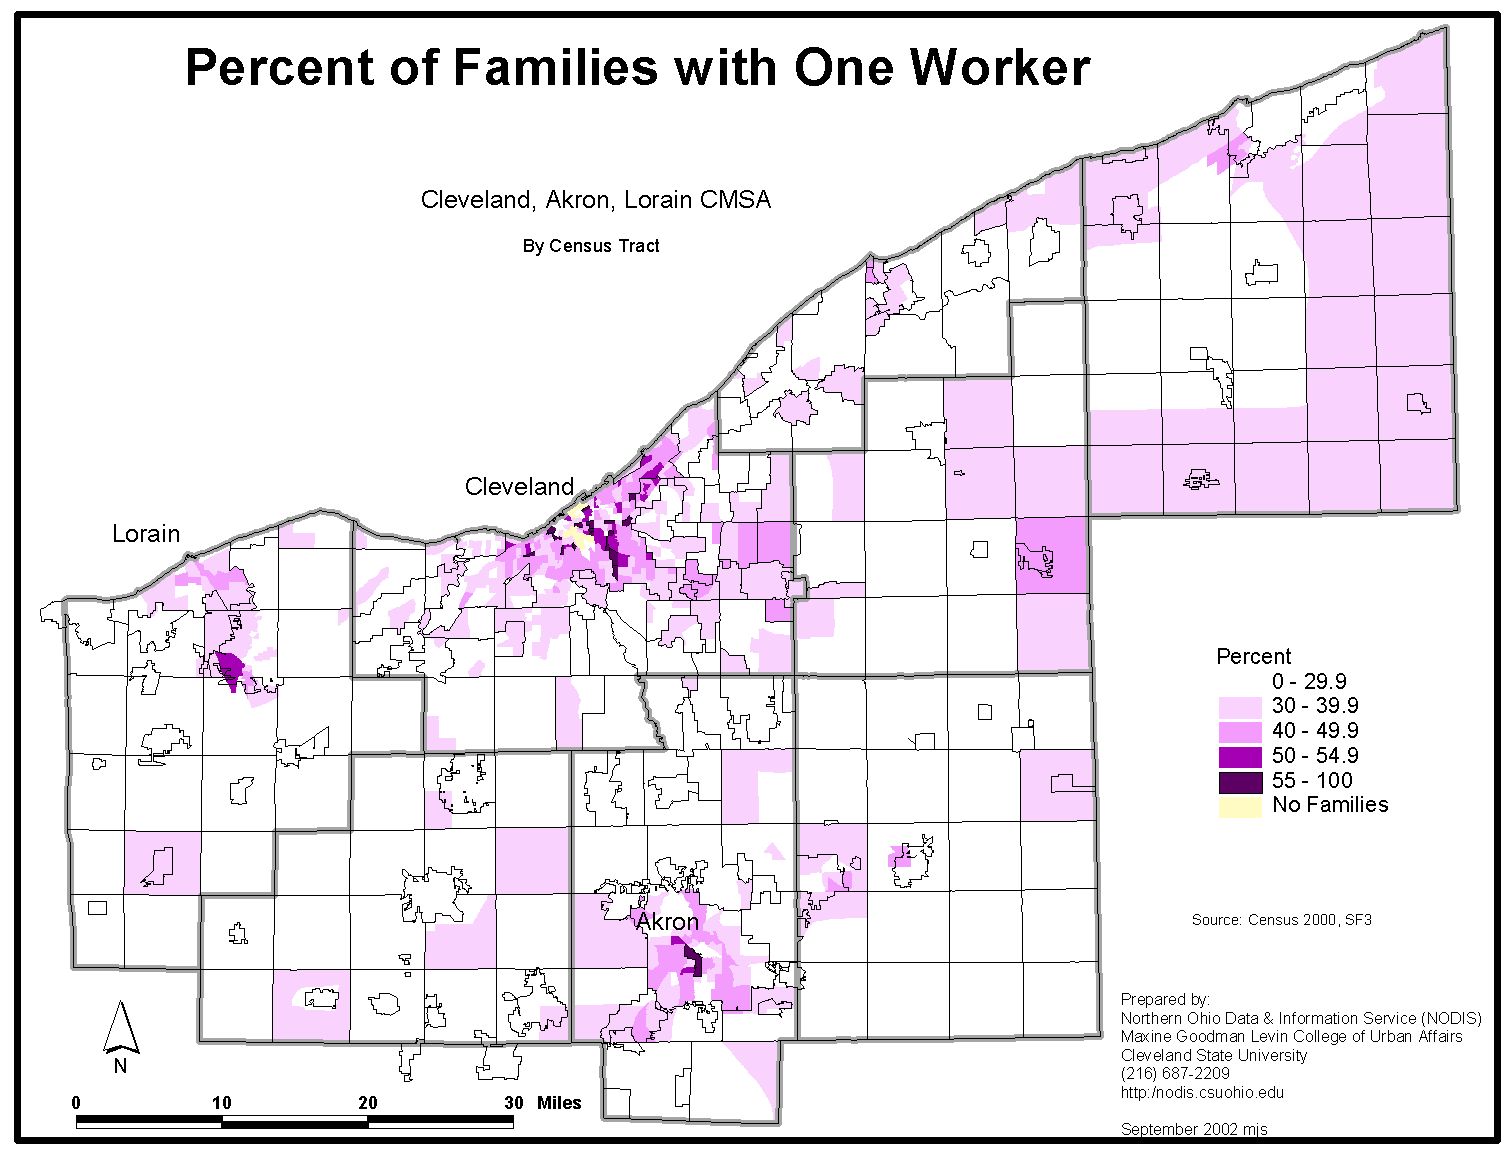 |
| Percent Unemployed | 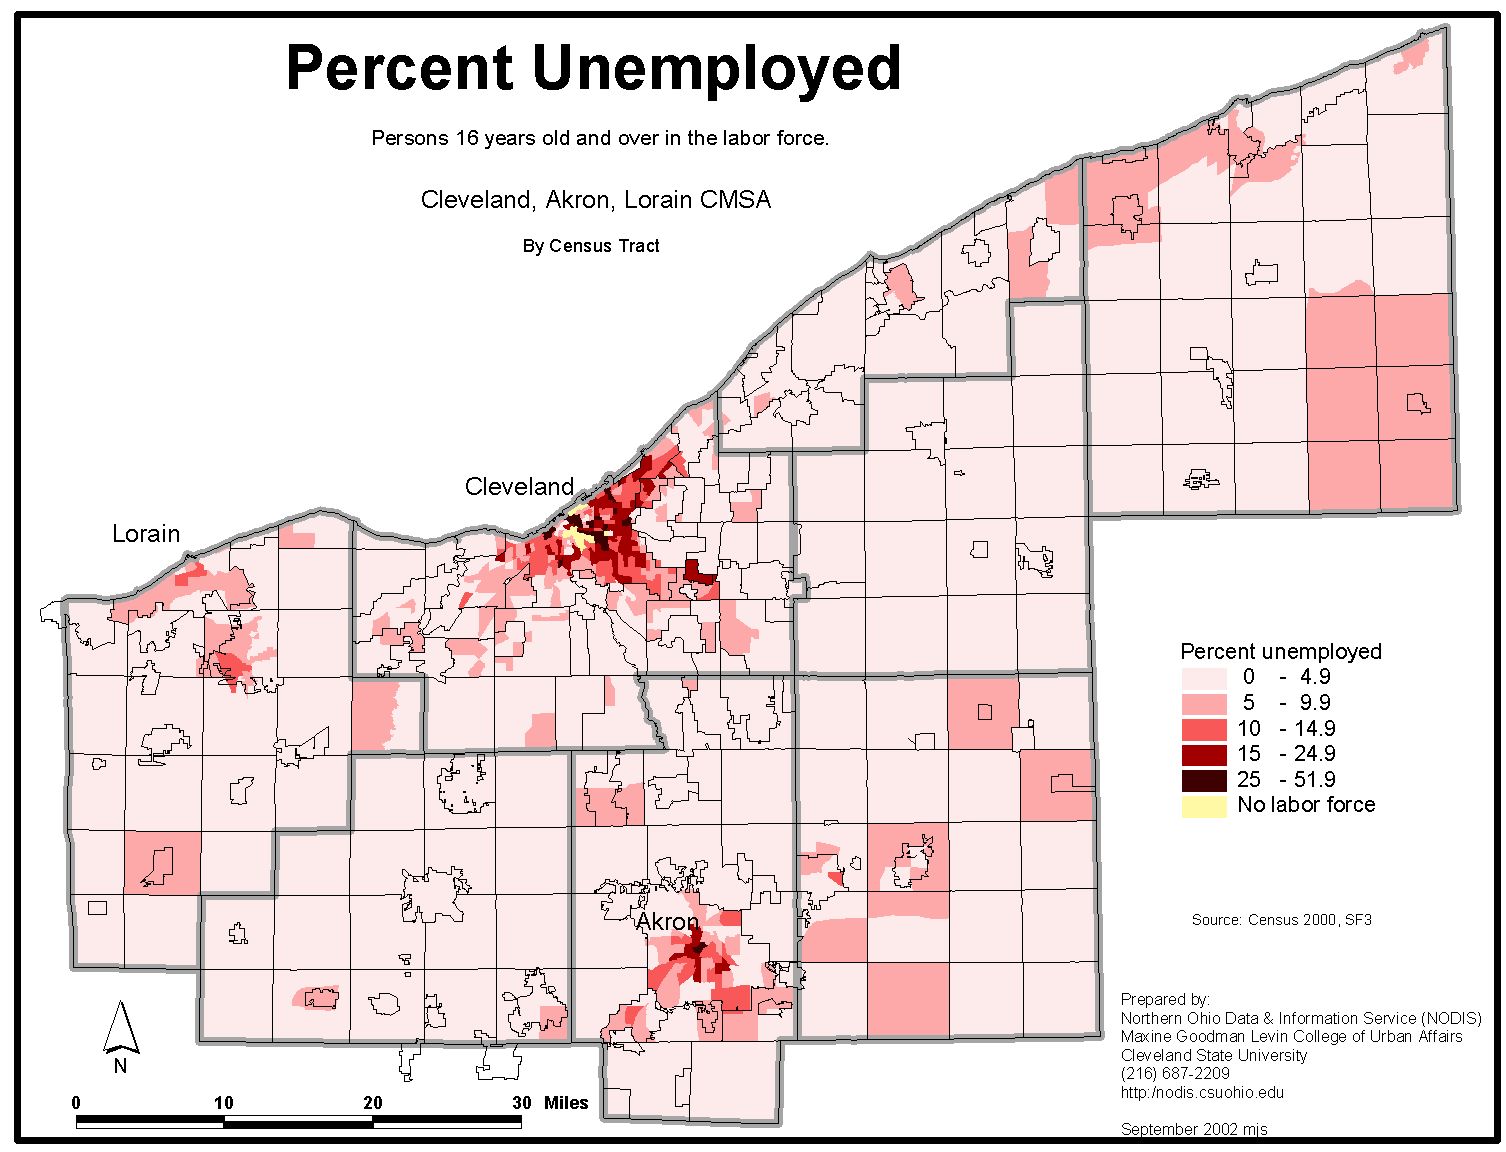 |
Percent of Families with Two Workers | 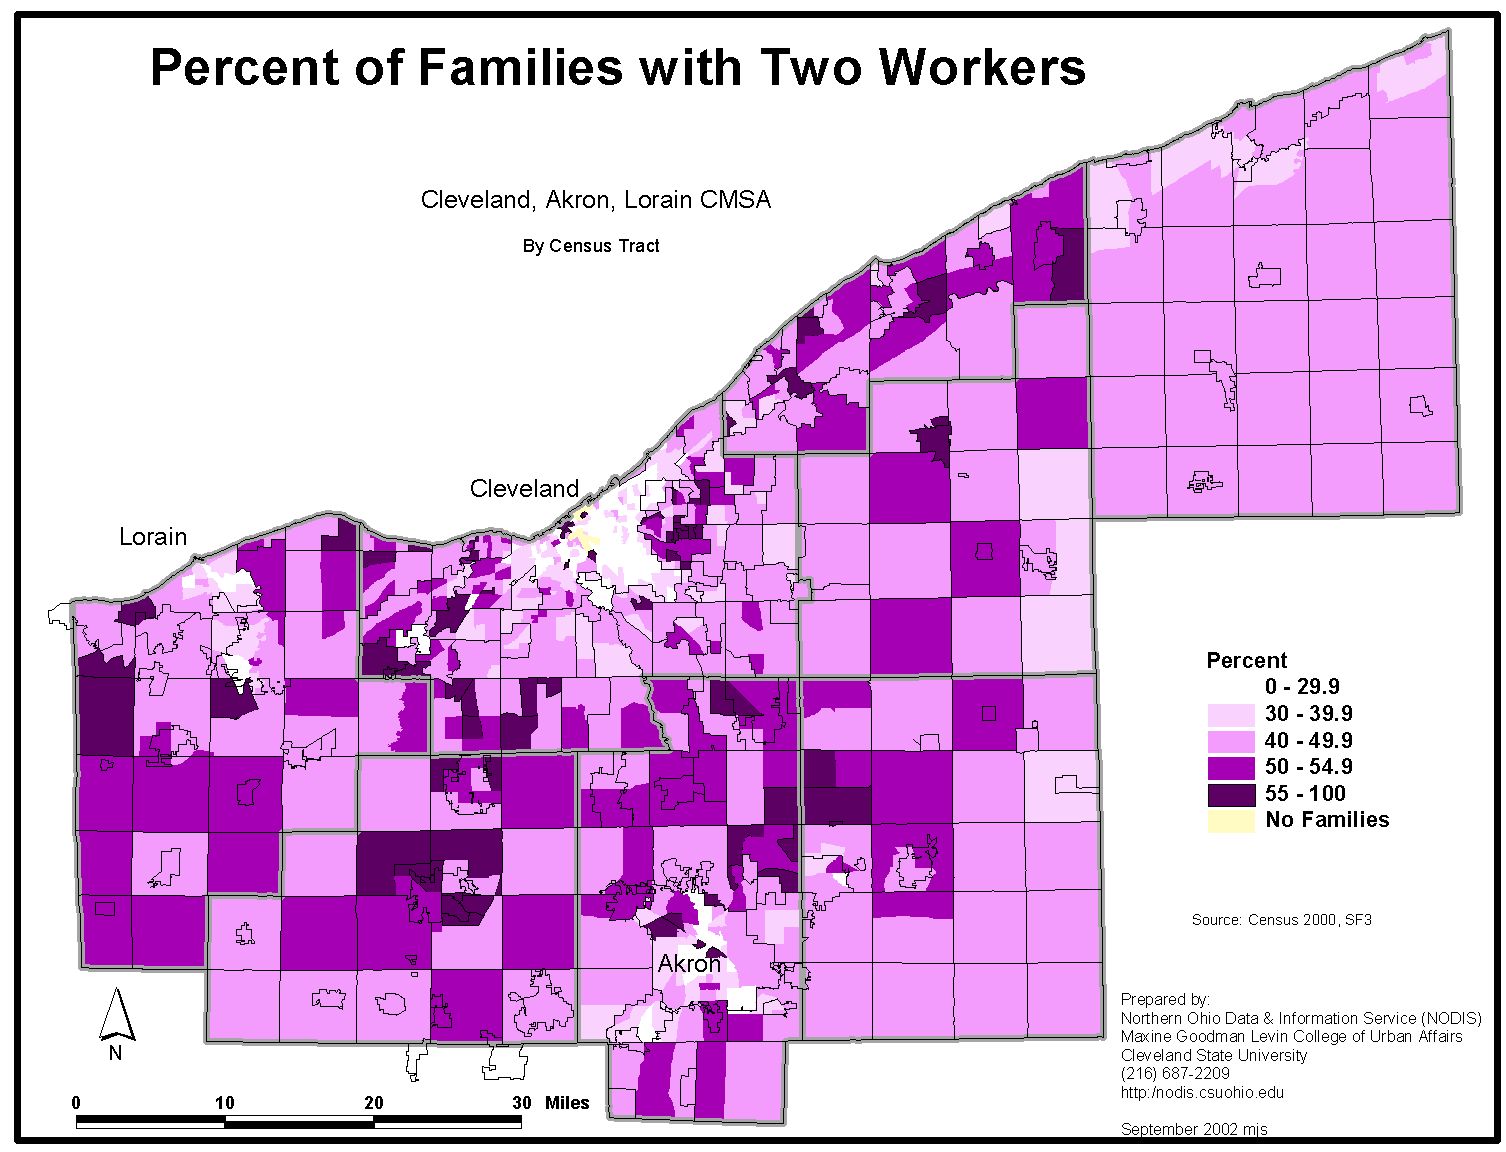 |
| Workers per Square Mile | 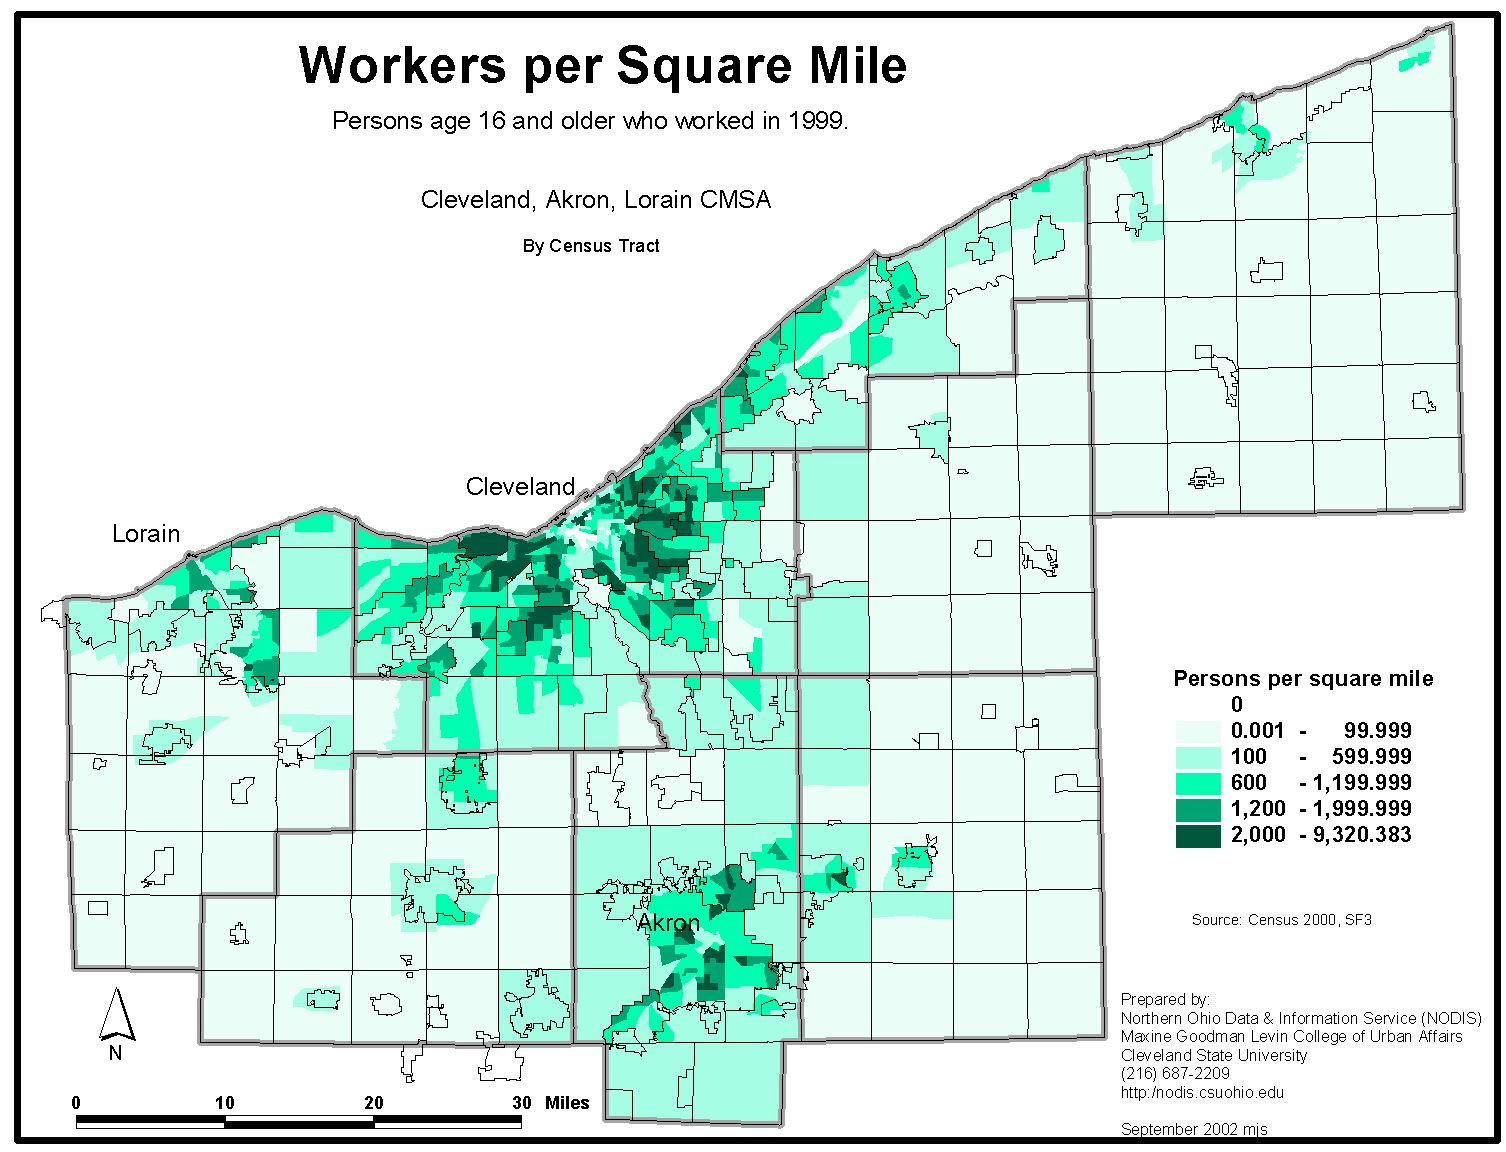 |
Percent with Income Under 50% of Poverty Level | 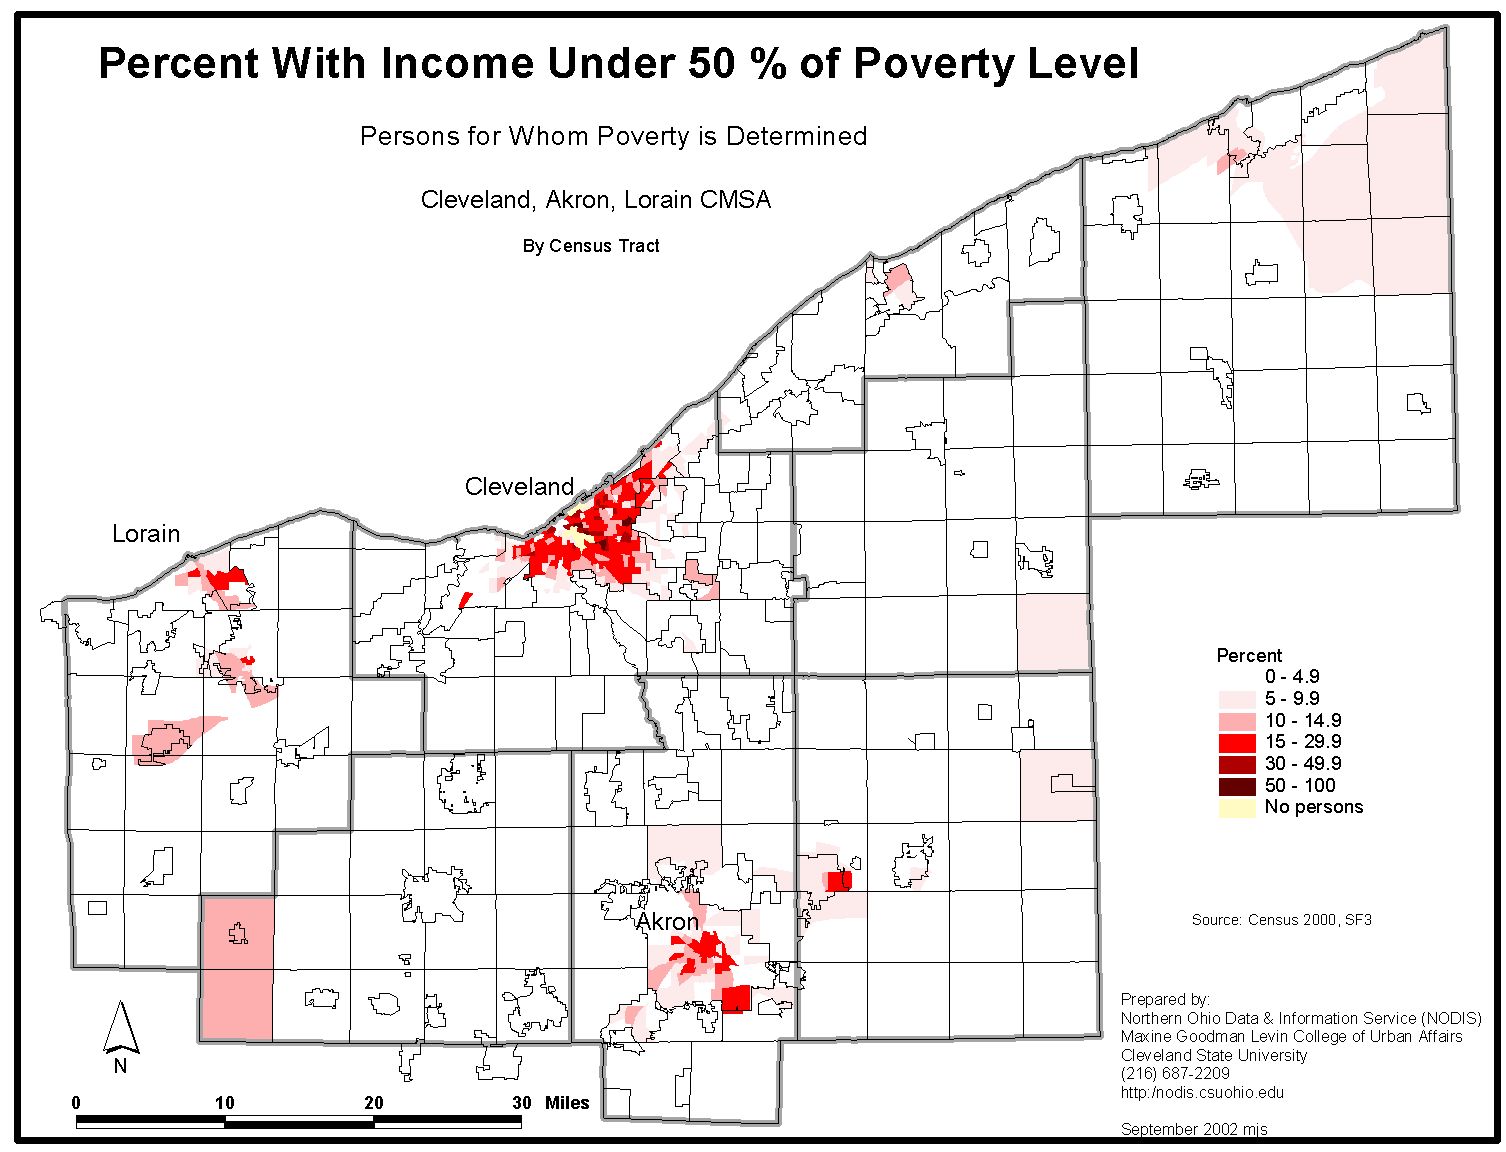 |
| Persons Working Part Time per Square Mile | 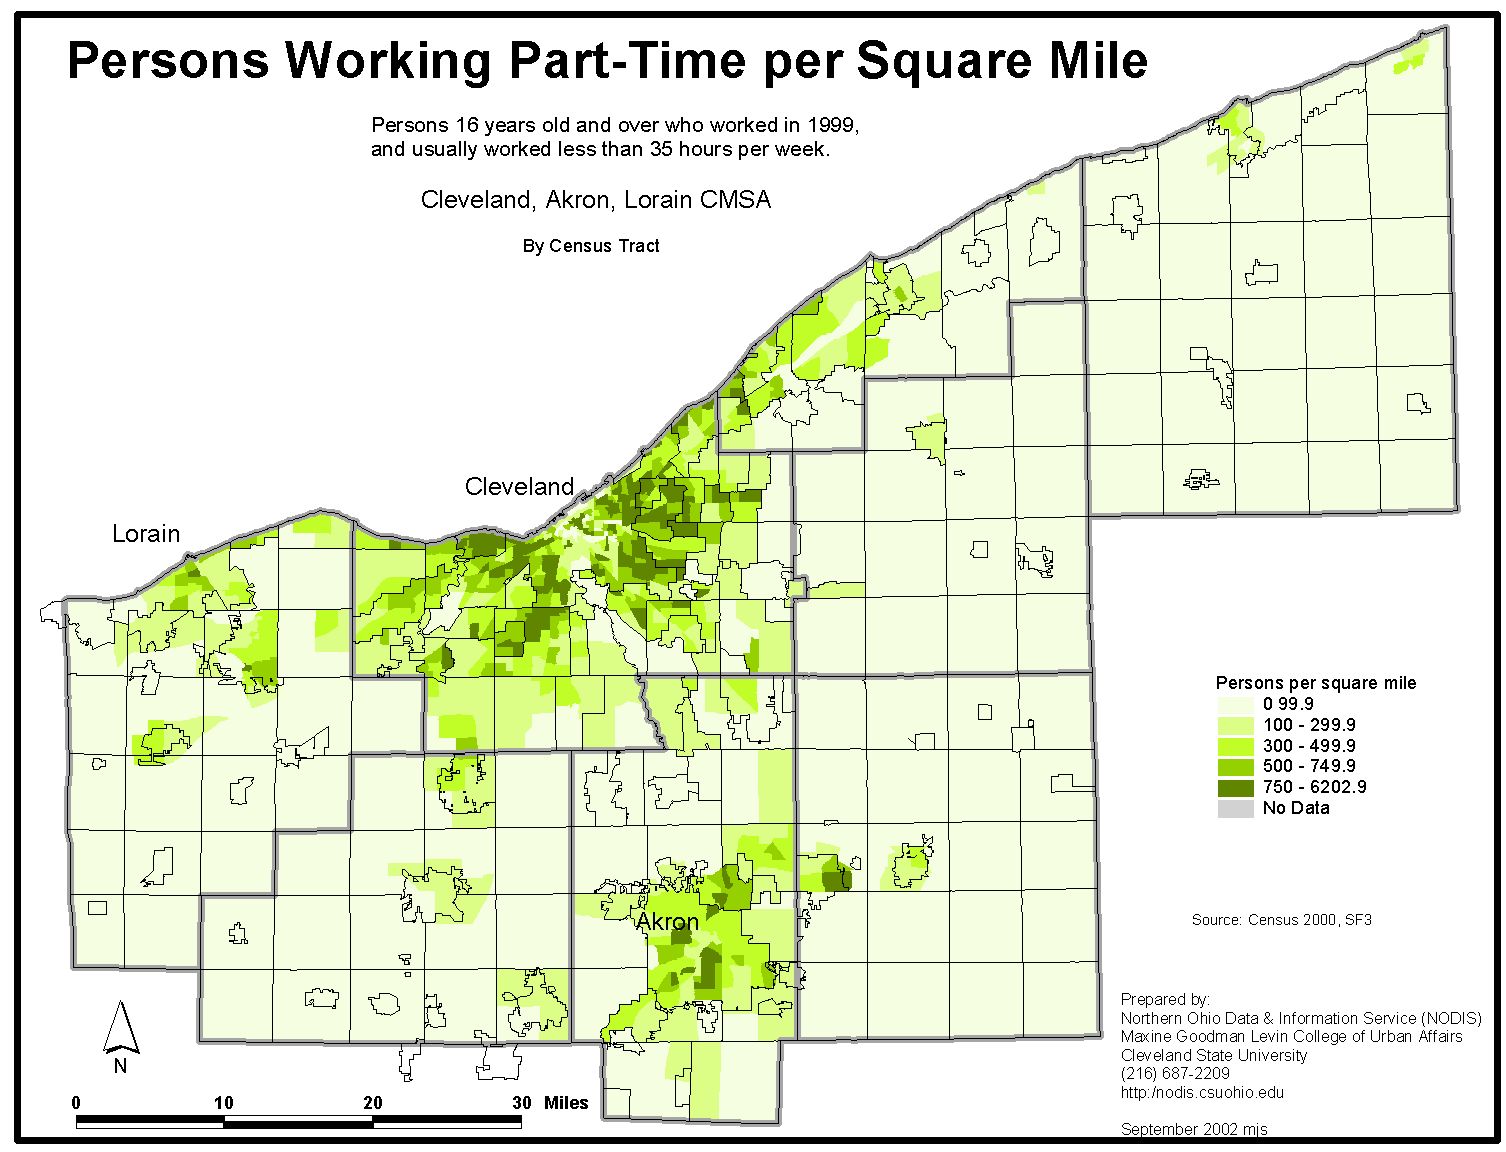 |
Percent Below Poverty | 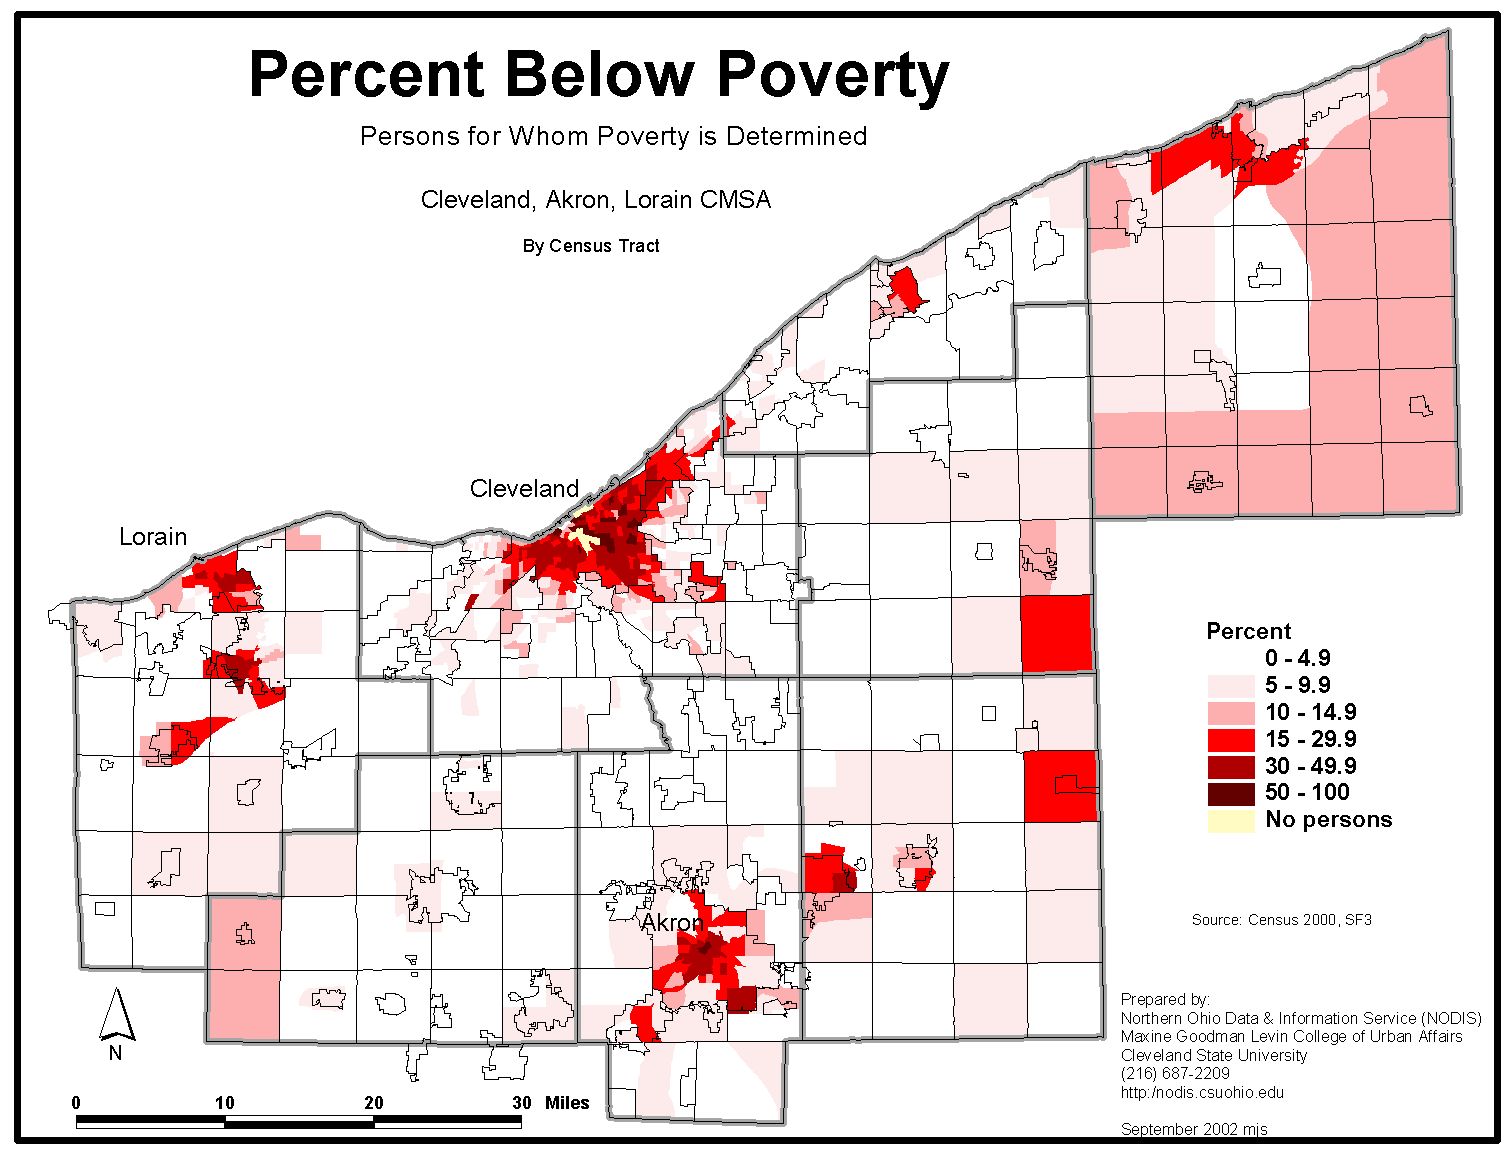 |
|
Change in Population Density April 2000 to July 2002 - Ohio, By City, Village, and Balance of County
|
 |
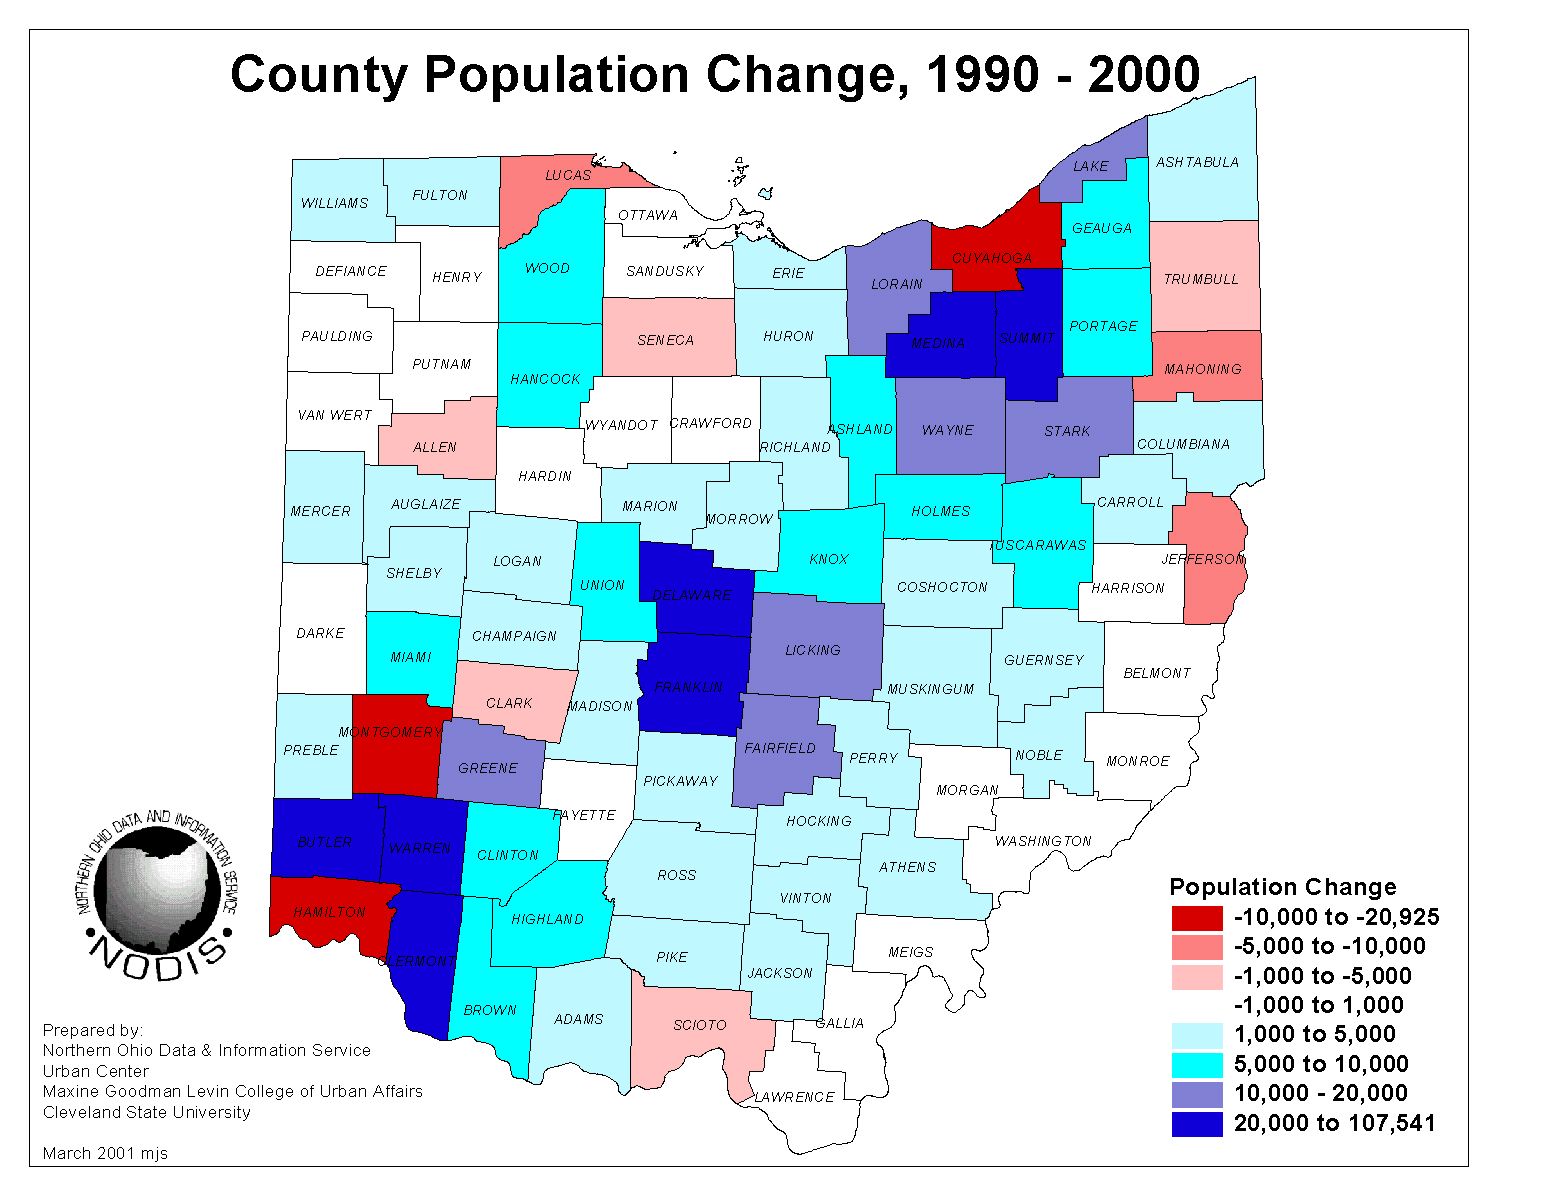
County Population Change, 1990-2000
|
 |
|
Percent Population Change April 2000 to July 2002 - Ohio, By City, Village, and Balance of County
|
 |
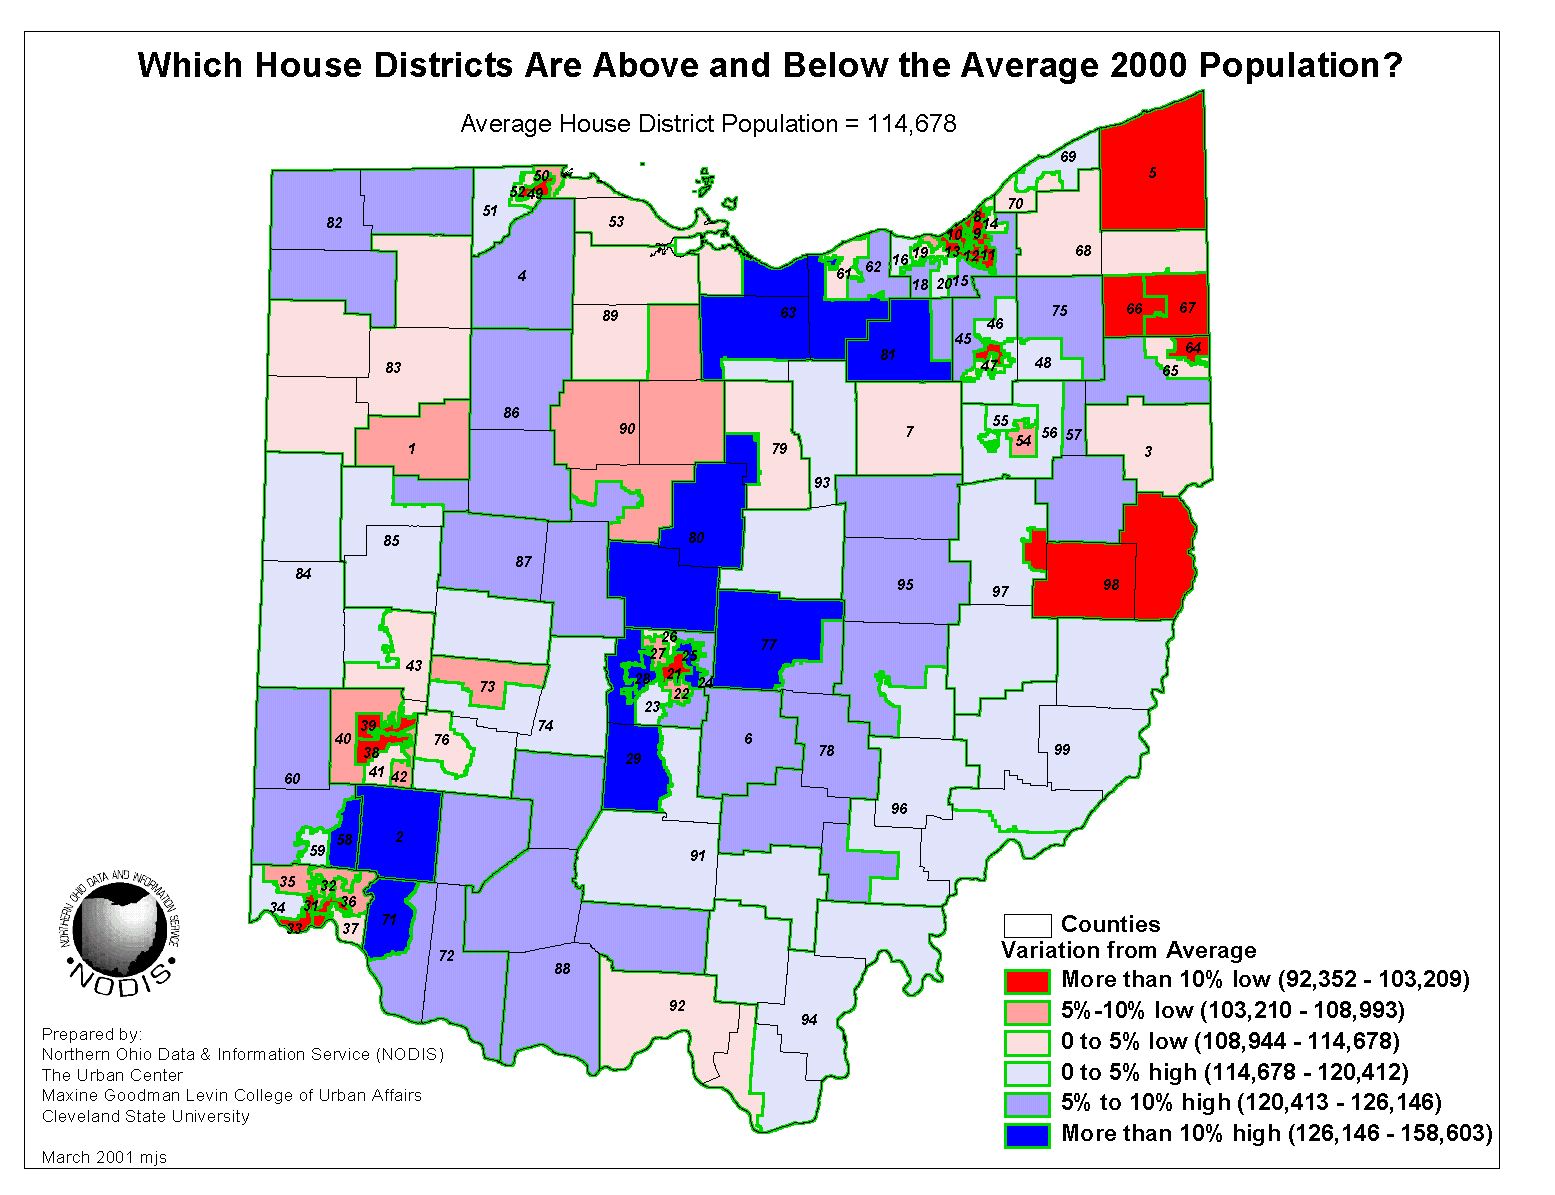
Which House Districts are Above and Below the Average Census 2000 Population?
|
 |
|
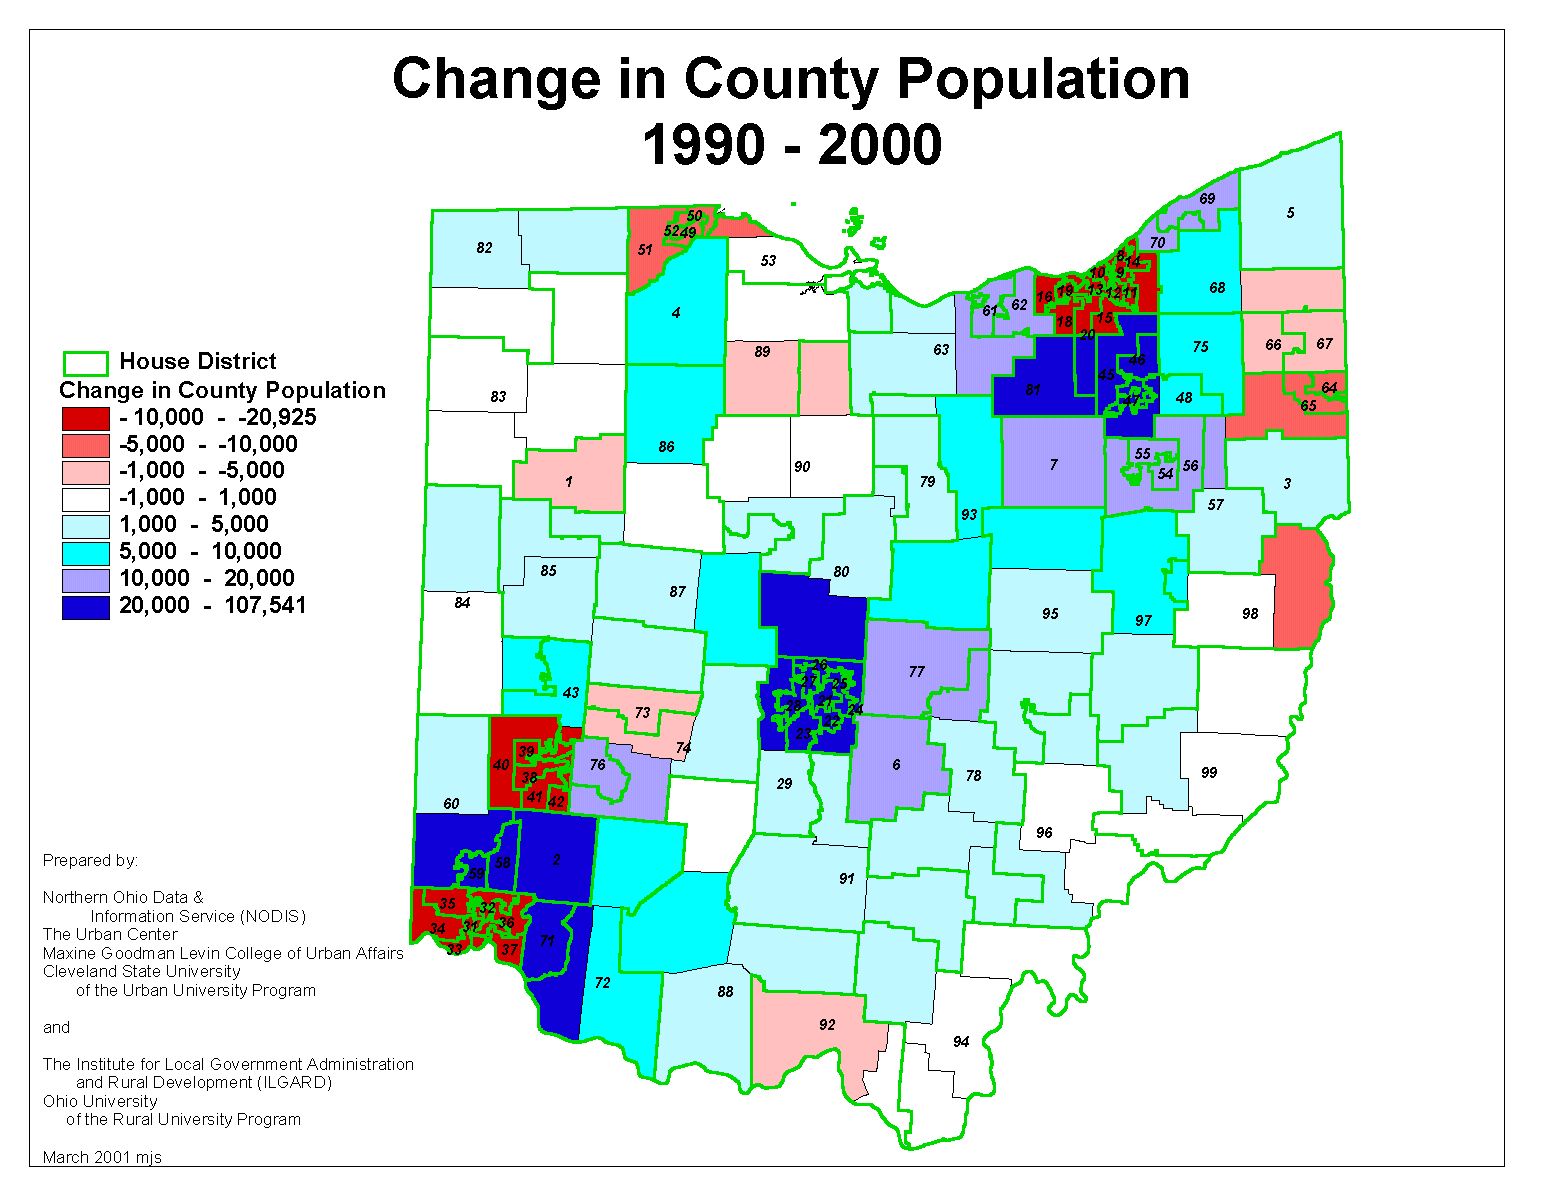
Change in County Population 1990-2000 (with House District Borders)
|
 |
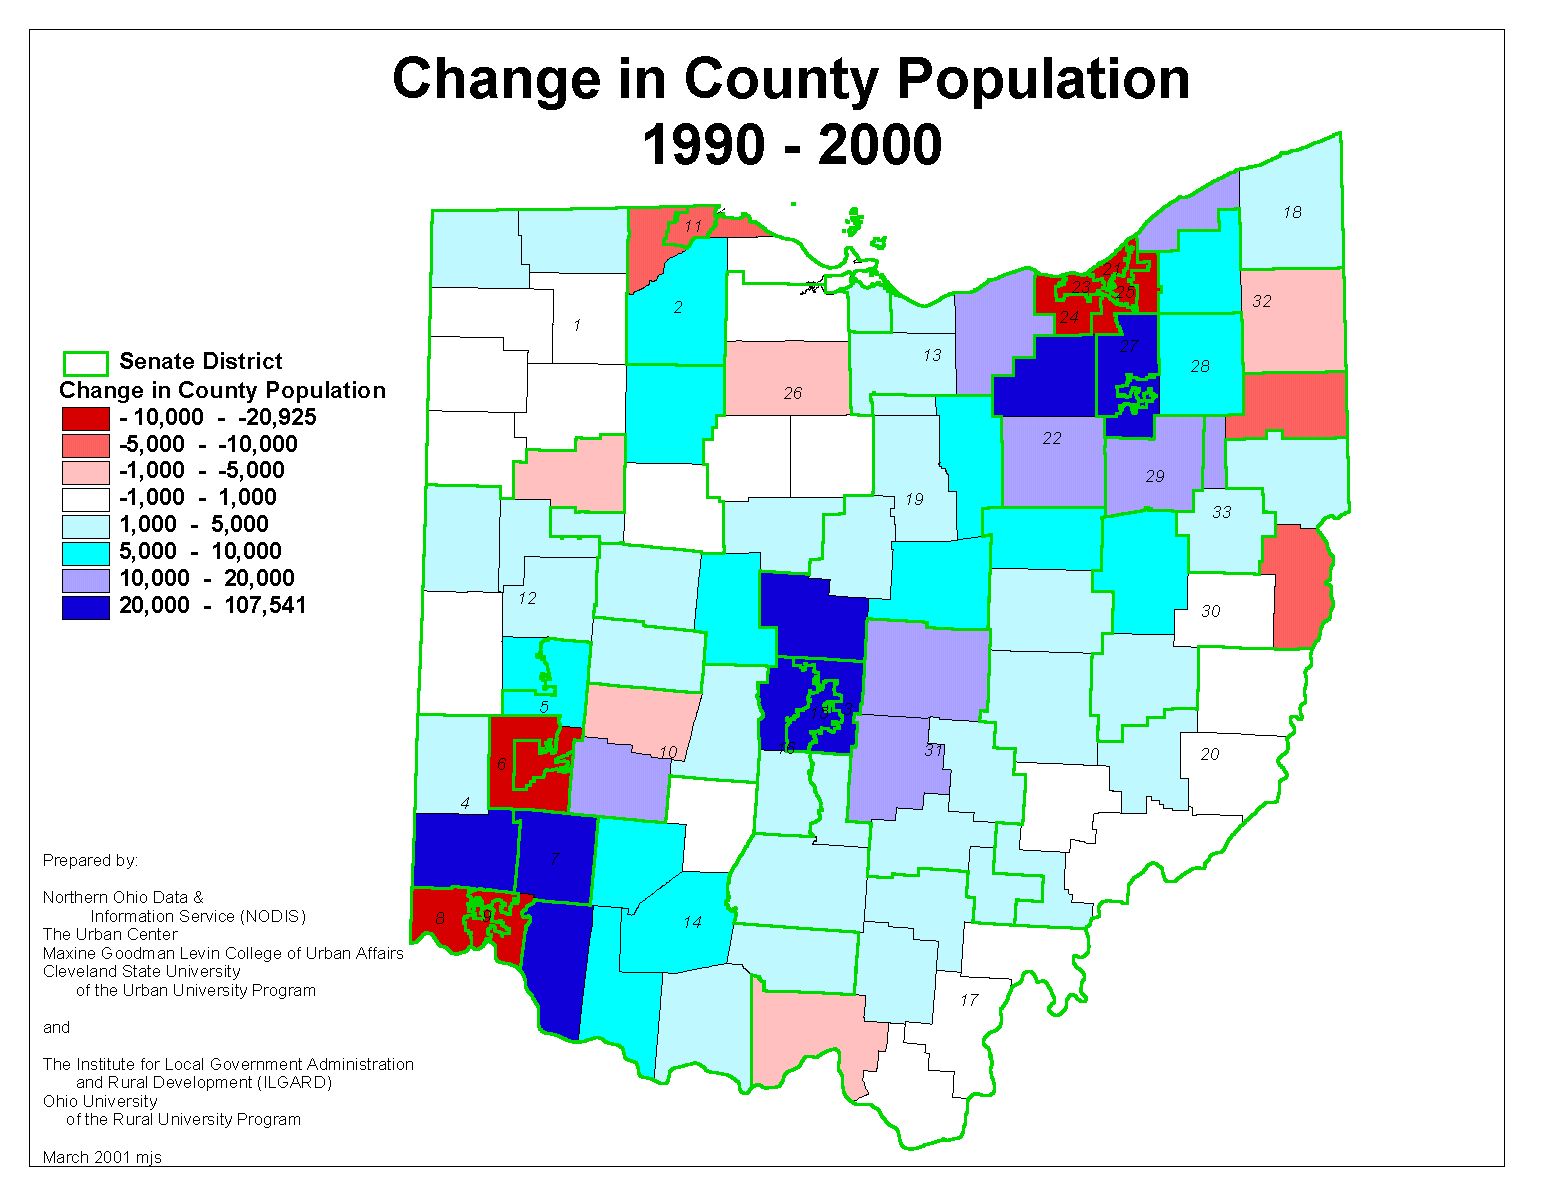
Change in County Population 1990-2000 (with Senate District Borders)
|
 |
|
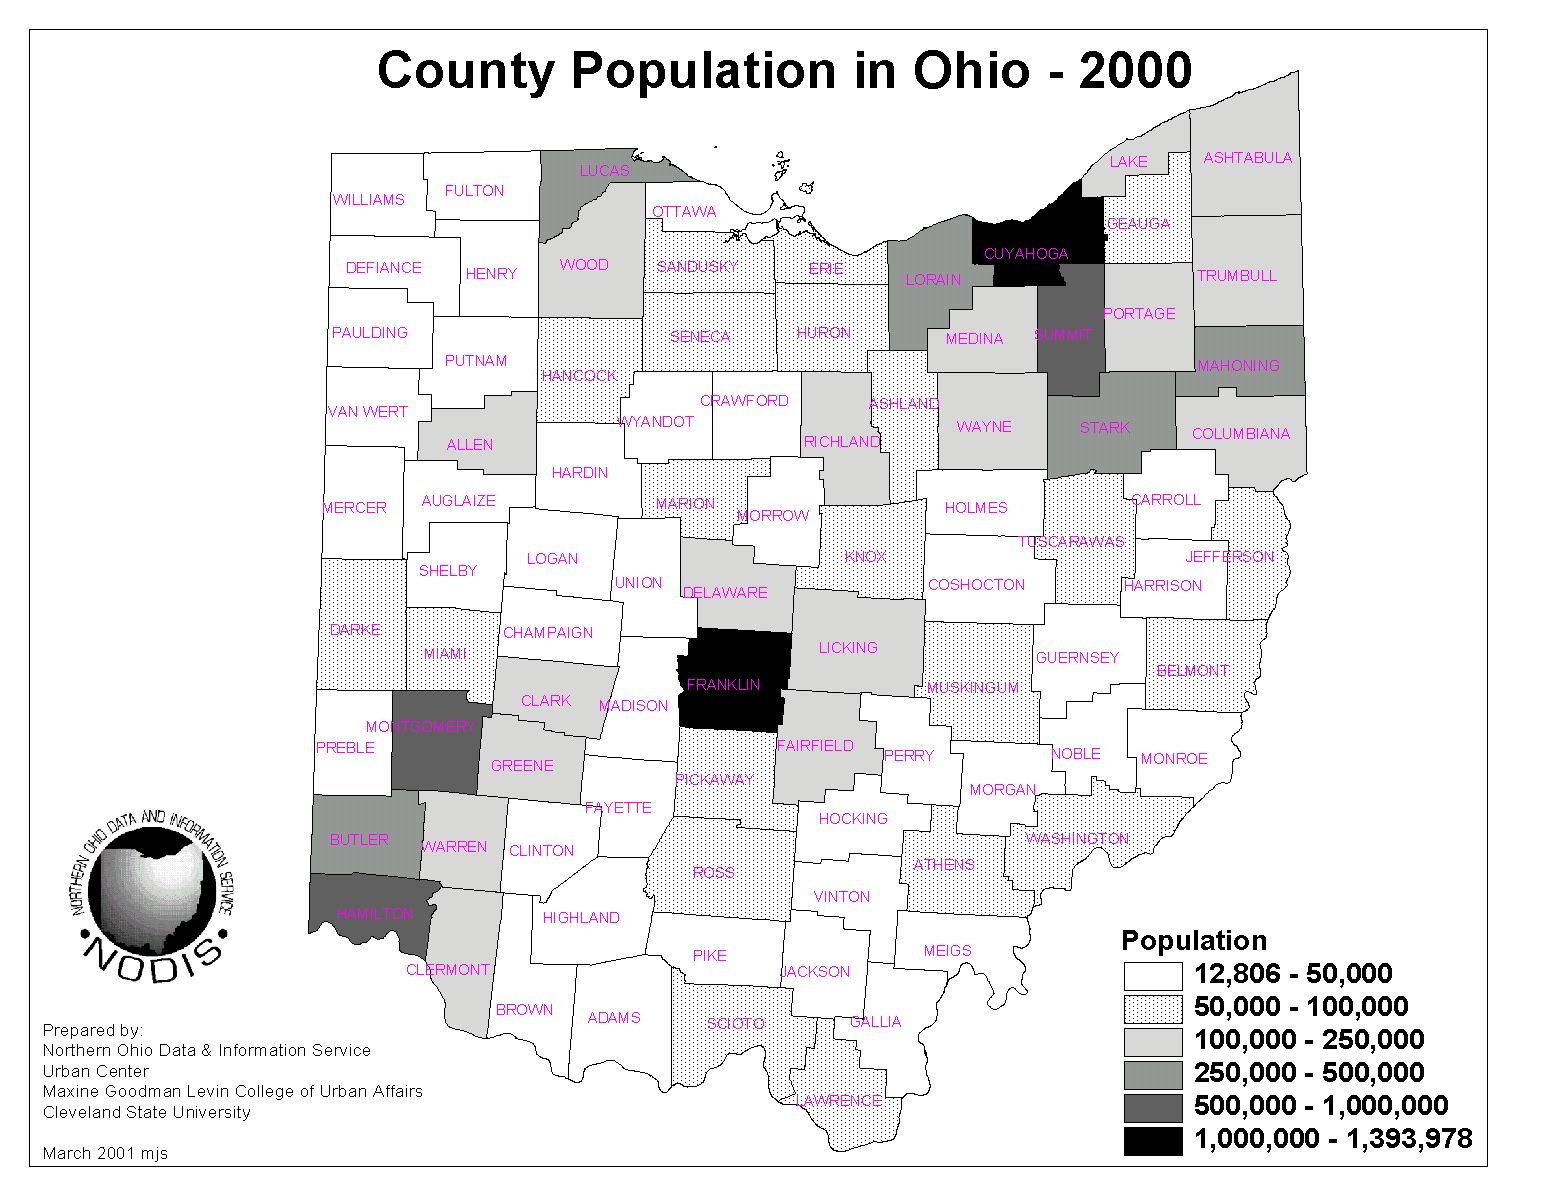
County Population, 1990-2000
|
 |
|
|
| Census 2000 Urbanized Areas in Ohio (Including Urban Clusters) | 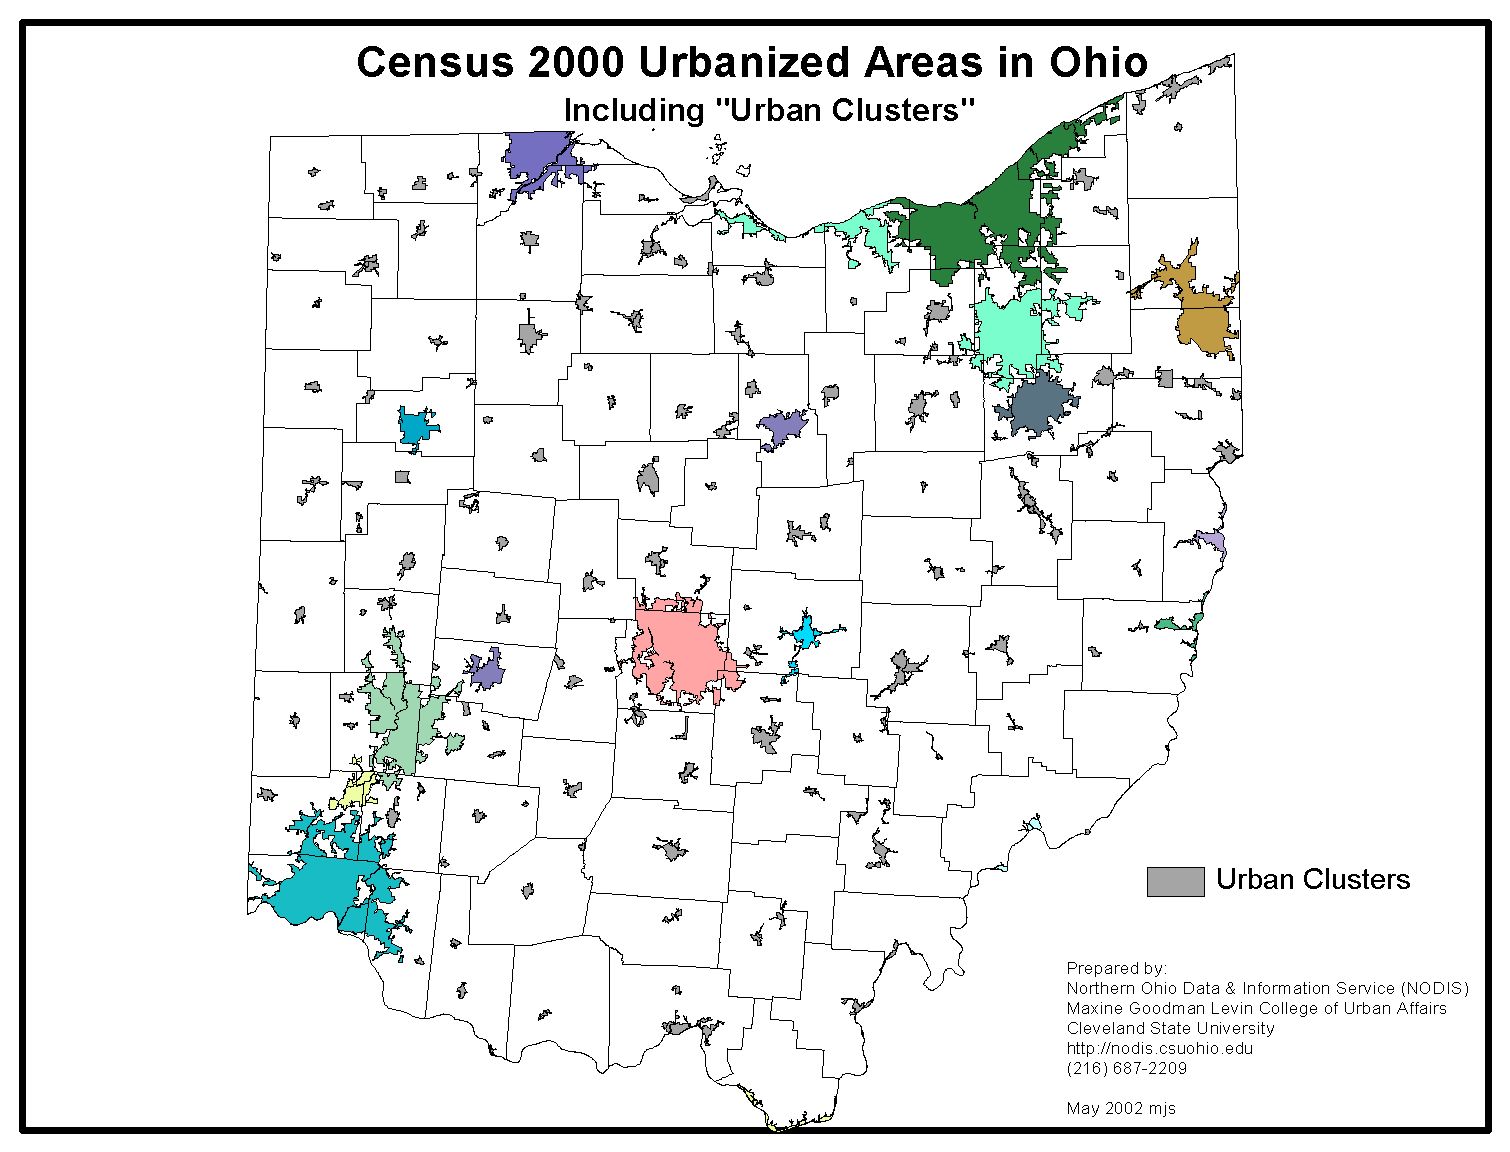 |
Statistical Areas: Micropolitan, Metropolitan, & Combined for Ohio, 2003 | 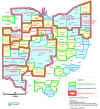 |